

• BTC/USD trade has been able to make rebounding motion, having suffered a slight setback.
• A bullish candlestick keeps a beefing-up manner from around the point of $45,000.
• Expectation is on a higher note that the BTC/USD market bull will regain its momentum very soon.
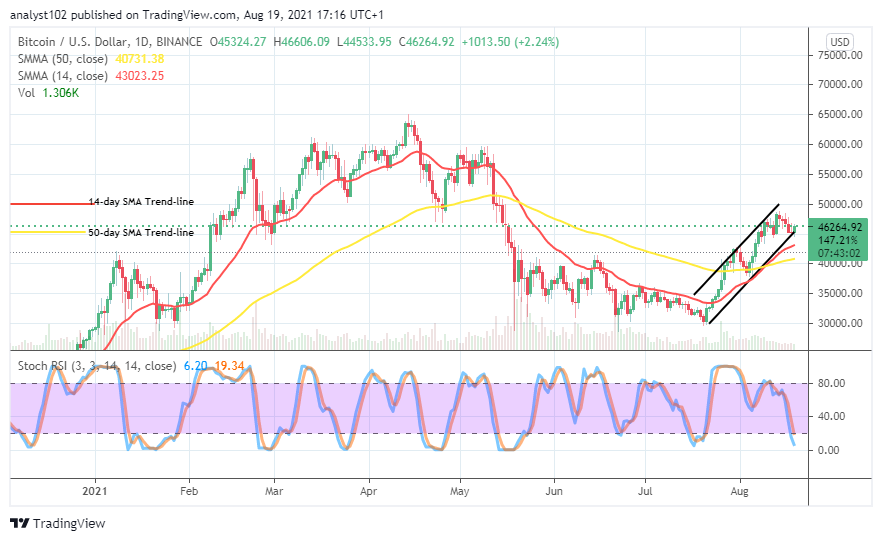
BTC/USD trade rebounds, having witnessed a setback in the last couple of days’ sessions. The daily chart shows that the bullish channel trend lines drew still play a relevant role. The recent downturn in the crypto’s valuation couldn’t successfully breach the lower bullish channel trend-line for sustainability underneath it. Currently, the market percentage rate is about 2.24.
Bitcoin Key Zones
Resistance Levels: $47,500, $50,000, $52,500
Support Levels: $42,500, $40,000, $37,500

BTC/USD Long Term Trend: Bullish
It is now shown on the daily chart that the BTC/USD trade rebounds, having witnessed a slight setback during the last business activities. As of writing, a bullish candlestick keeps a beefing up manner from around the point of $45,000. The 14-day SMA trend-line remains on top of the 50-day SMA trend-line, pointing northward below the present trading zone of the market. Another notable thing is that price has been able to find support around the lower bullish channel trend-line. It now appears that the market bull is on the move toward regaining strength.
On the downside, the Stochastic Oscillators have freshly penetrated the oversold region, seemingly attempting to close the lines. That signifies that a change could occur in the style that the market has been pushing over a session. All that said aside, the $45,000 market line that needed to have breached sustainably, the price has now been rebounded, making it difficult to see a reliable continuity in the recent market’s price correction.

BTC/USD Short Term Trend: Bullish
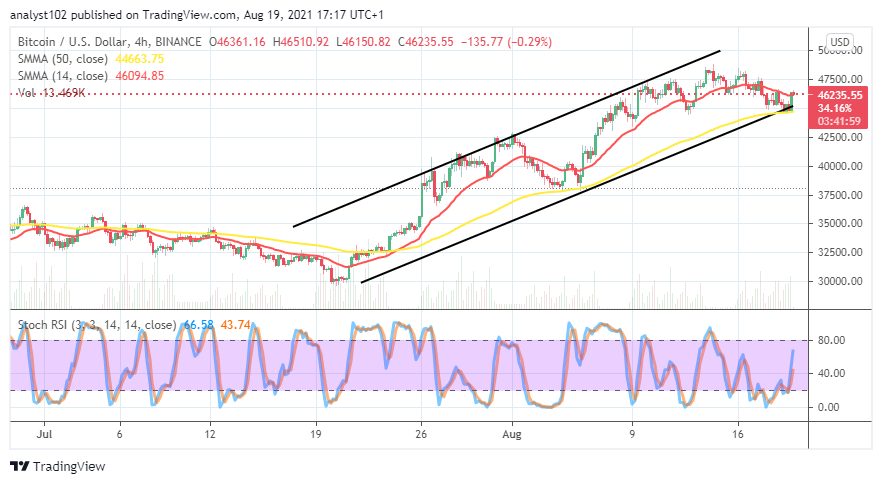
The upward trend is also kept on the BTC/USD 4-hour chart as the crypto trade rebounds, having witnessed a setback during the recent business operation. Abolish candlestick has emerged on the 4-hour chart to engulf some of the past candlesticks that featured above $44,000. That signifies a return of an upswing in the crypto economy.
The bullish channel trend lines remain intently drawn, almost embodying the SMAs. The 50-day SMA indicator is alongside the lower bullish channel trend-line as the 14-day SMA indicator bends slightly southward a bit over them. The Stochastic Oscillators have crossed the lines northbound briefly past range 40.
Some of the indicators have raised the expectation higher on the side of the BTC/USD market bull. That means the crypto economy will soon be mooning further.
Also read: As Miners Relocate Overseas, Bitcoin Mining Difficulty Continues to Surge
Note: Crypto-academy.org is not a financial advisor. Do your research before investing your funds in any financial asset or presented product or event. We are not responsible for your investing results.