
• BTC/USD now slightly declines while it failed to push northward further past the resistance level of $50,000.
• The support line of $45,000 remains a strong point that the price hasn’t trade past further to the downside.
• The crypto market value of $47,500 is the vital trading line.
The market activity of BTC/USD now slightly declines valuation while it failed to push northward further past the resistance level of $50,000 that it averaged during yesterday’s trading session. The crypto economy rate of percentage stands around -4.00 to trade at the level of $47,777 as of writing. The pace of the current downward price motion appears forthcoming in the manner of corrections. That means that the expectation is still high as regards getting to the market reversing back into an upward movement in no time.
Bitcoin Key Zones
Resistance Levels: $50,000, $52,500, $55,000
Support Levels: $45,000, $42,500, $40,000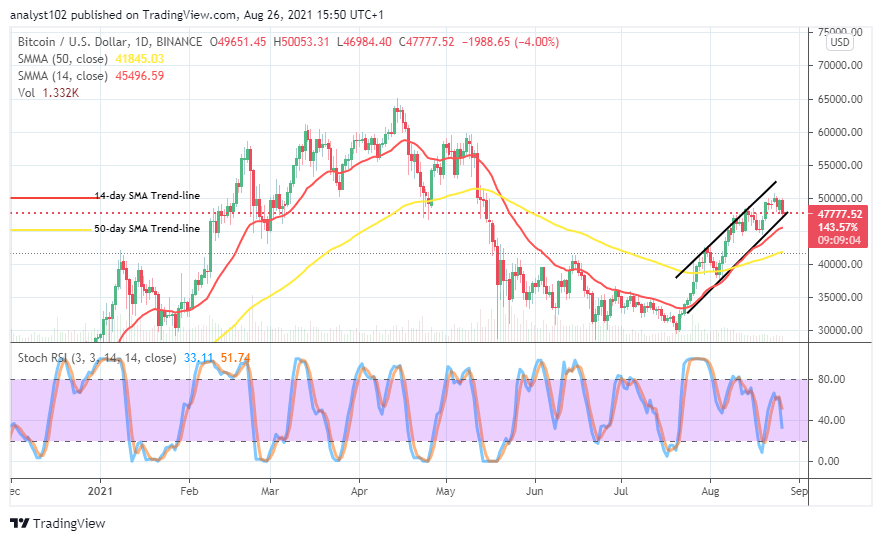

BTC/USD Long Term Trend: Bullish
The resistance trading line at $50,000 has concurrently featured as the area where the BTC/USD market reverses while pushing higher northward. Presently, the crypto market activity slightly downsizes in valuation in the bullish channel trend lines. Today’s slight downward has led to the emergence of a bearish candlestick very close to the lower bullish channel trend-line. The 50-day SMA indicator is underneath the 14-day SMA indicator. The smaller SMA trend-line is around $45,000 support line. Bull expected to re-energize sooner than later.
On the downside, it established that the BTC/USD market bear has severally gained upper hands, regaining the market control around the resistance of $50,000. The support line of $45,000 remains a strong point that the price hasn’t trade past further to the downside. The Stochastic Oscillators have crossed the lines southbound briefly past the range of 40. That showcases that a downward force is somewhat prevailing in the crypto economy as of writing. A breakdown movement against the lower bullish trend-line may lead the price to touch the support.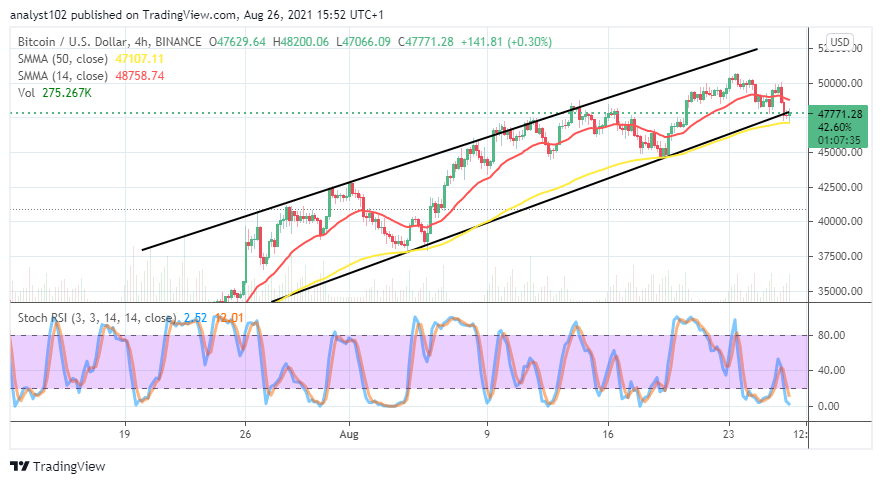

BTC/USD Short Term Trend: Bullish
The BTC/USD 4-hour showcases that the crypto market activity slightly declines valuation in the bullish channel trend-lines drew. The lower bullish channel trend-line is on the verge of breaching southward. The 14-day SMA indicator is above the 50-day SMA indicator as the bigger indicator keeps a stance around $47,500 to indicate the crucial trading point between the two major market movers.
The Stochastic Oscillators around the range of zero in the oversold region signifies the probability that the crypto will regain its lost momentum in no time. Therefore, shorting positions furthermore at this point isn’t encouraging.
Conclusively, the crypto market value of $47,500 is the vital trading line. And, the two major market movers will have to pay much attention. A rebounding motion will likely put the price back upside. Like wisely, an aggressive breakdown may portend a resumption of a downward trend.
Also read: BTC/USD Bulls Bounce Off $37.500 Key Level To Go Higher
Note: Crypto-academy.org is not a financial advisor. Do your research before investing your funds in any financial asset or presented product or event. We are not responsible for your investing results.