

Binance Coin is an industry pioneer when it comes to setting up new standards. Our BNB price analysis shows that the BEP-20 token is facing strong resistance to acquire a $330 high after a good raise.
Where Bitcoin is dubbed the king of cryptocurrency, BNB can be dubbed as the king of exchange coins. BNB price hit the year-to-date (YTD) high on the 2nd of January 2022 when it reached the $531 high.
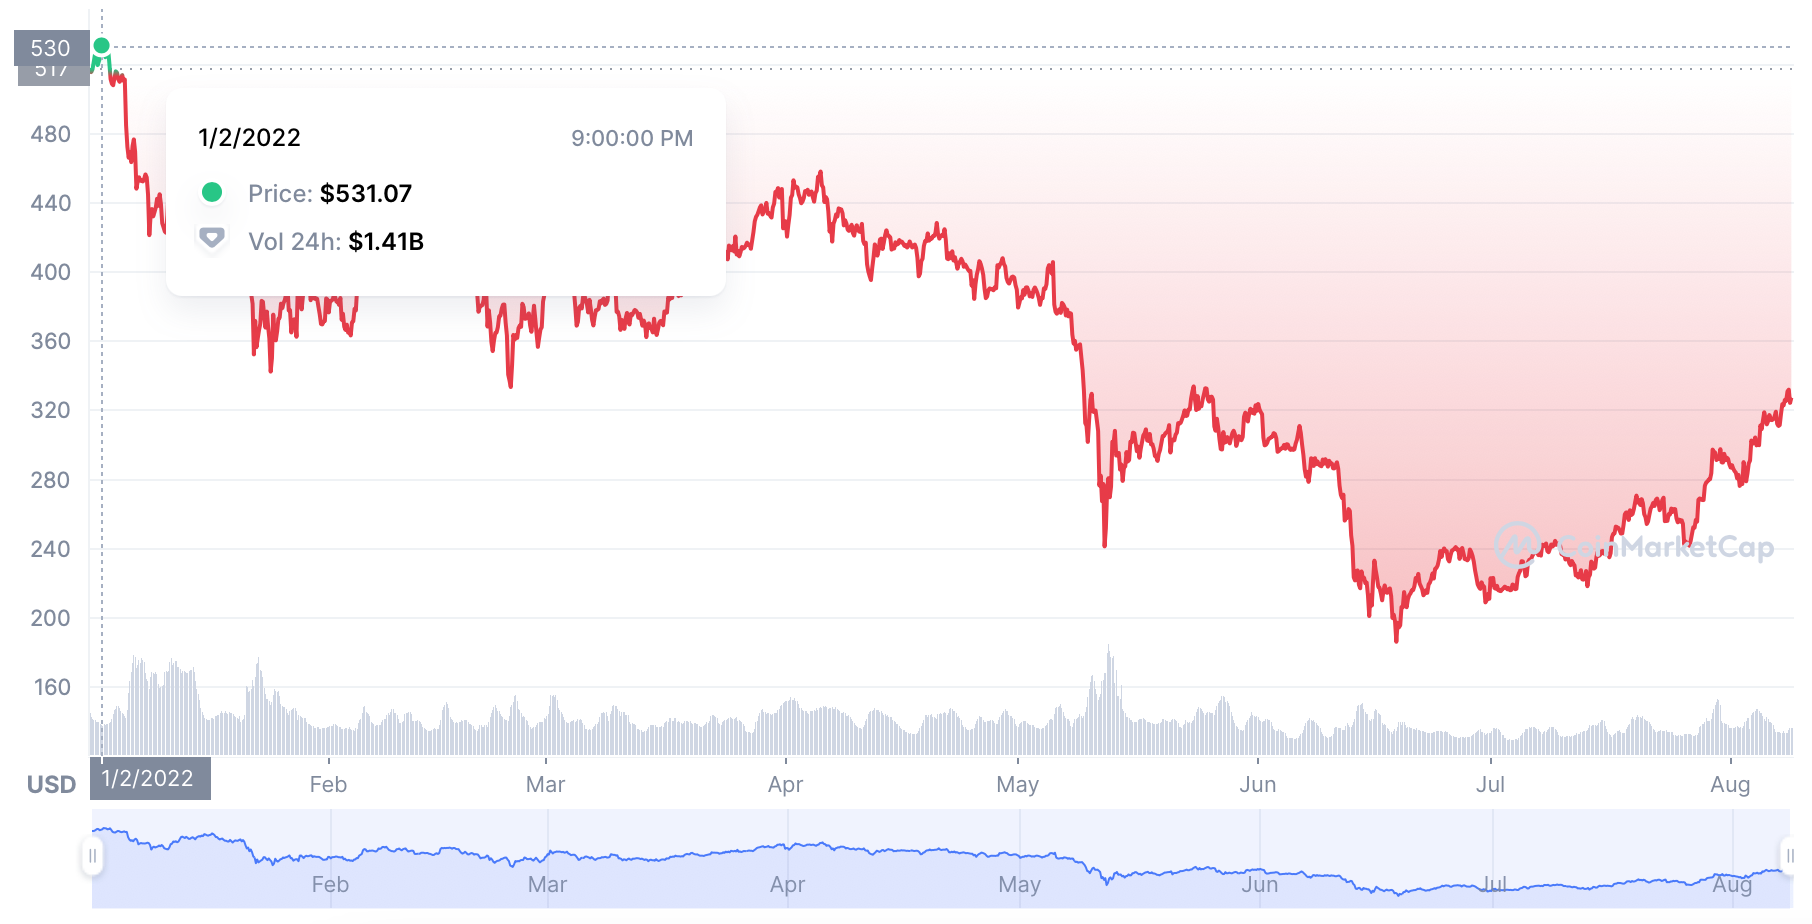
BNB price chart by CoinMarketCap

Soon after the year-to-date high, the BEP-20 token saw a quick incline in the price as most cryptocurrencies and tokens have to fall down to the $420 level by the 8th of January and to the $340 level by the 24th of January, 2022. The kind of exchange coins has not been able to recover to the YTD levels since the first month of the year, however, to no surprise.
In May 2022, BNB price managed to hit past the $350 mark only to fall back down, and this time to the $241 levels in the following month. Q3 of the year 2022 has been rough for the cryptocurrency market with major players shifting and Twitter vs. Elon Musk like issues showcasing the worst pump and dump of the history of cryptocurrency.
BNB Price Analysis: BNB facing resistance for $330 high
At the time of writing BNB price is facing strong resistance to reach a new $330 high. While writing the expected price high went down from the $335 to the $330 mark. This signifies the strong market resistance holding the price down at the time of writing. While in the past 24-hours only one of the top ten cryptocurrencies (by market capitalization) have been able to mark any gains in the price.
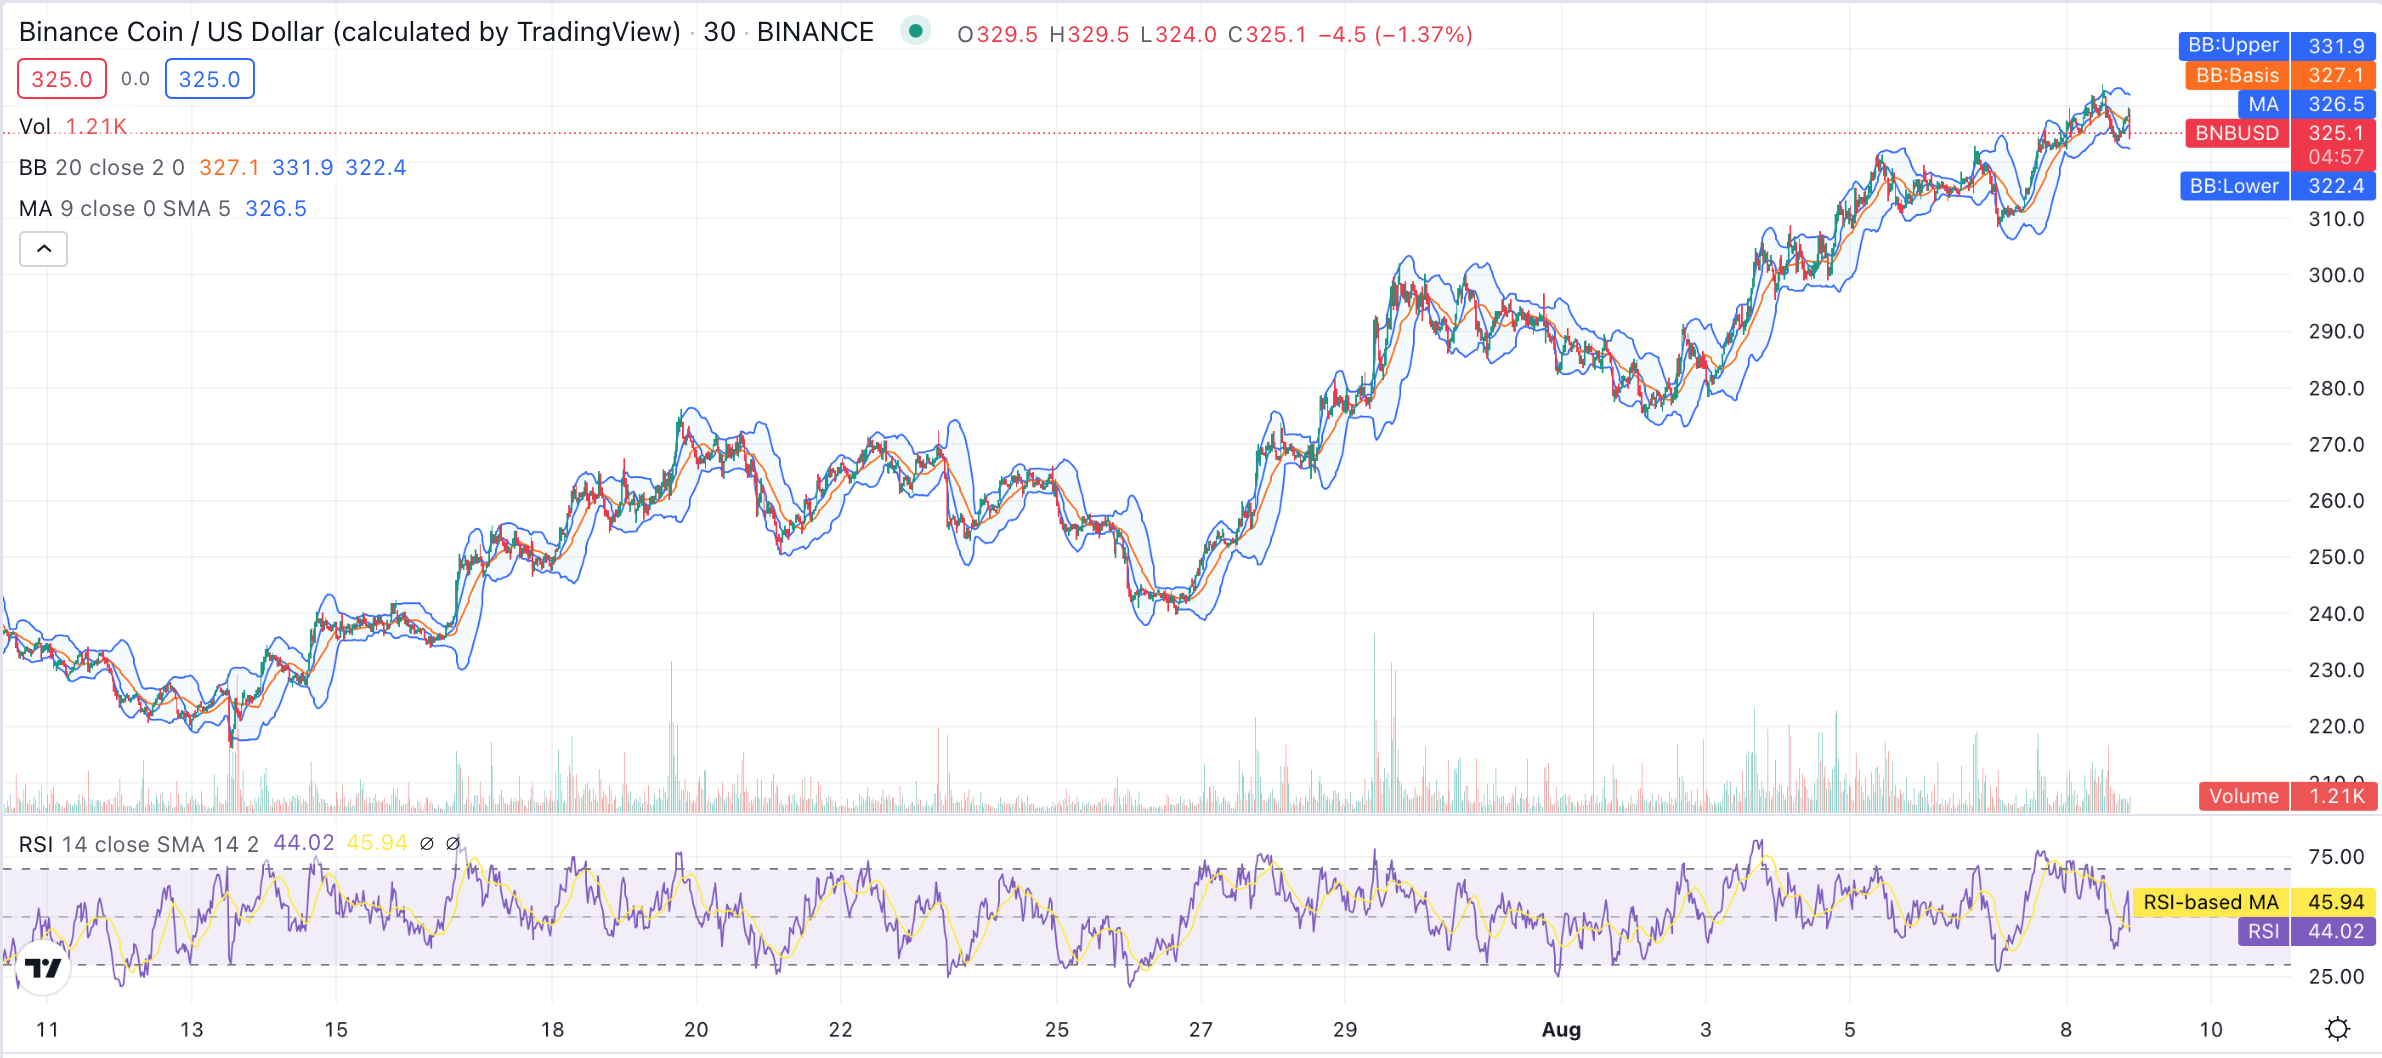
BNB price analysis chart made with TradingView

BNB price is hovering between the $325 and $328 mark at the time of writing. A small reverse head and shoulder movement is evident on the chart that allowed the price to jump from the $310 levels to the current price levels.
The moving average (MA) serves as the first resistance point on the chart at $326.5, while the Bollinger Band average (BB-Base) serves as the second resistance point at $327.1 mark. The 30-minute trading volume of stands at 1,210 transactions, significantly down from earlier in the day and week.
The strongest resistance is marked by the Bollinger Band upper limit fluctuating between the $331.9 and $332.7 marks at the time of writing. Although the current relative strength index (RSI) score stands at 44.02, the moving average of the month stands relatively higher at the $45.94 mark.
BNB price appears to be stabilizing above the $310 mark; however, big market sways can bring the price down to $300 and further below to the $280 mark. If the RSI stays stable within the 40-60 range, BNB is likely to maintain the current price levels against the market current. However, occasional fluctuations are evident on the chart, and such an event can cause a loss of support.
As the end of the year s, Binance is also opening up new market areas such as the NFT marketplace for users moving into more stable markets. Such measures are not only likely to maintain the BNB price above $300 mark but also push it back towards the $400 high and beyond.
Take Aways
- Binance Coin is progressing well despite current down market.
- BNB price likely to stay stable above $300 mark.
- Resistance is building on the token due to market movement.
- NFT marketplace and new sections on the exchange would support the price movement.
Disclaimer: The information provided on this page is most accurate to the best of our knowledge; however, subject to change due to various market factors. Crypto-Academy encourages our readers to learn more about market factors and risks involved before making investment decisions.