

BNB Technical Analysis – October 2021
Monthly Analysis
Over the last 30 days, BNB has been on the rise. Its price has increased by 58% over this period, and it is bullish. With this uptrend, we can expect the price of BNB to keep increasing in the coming days.

Weekly Analysis
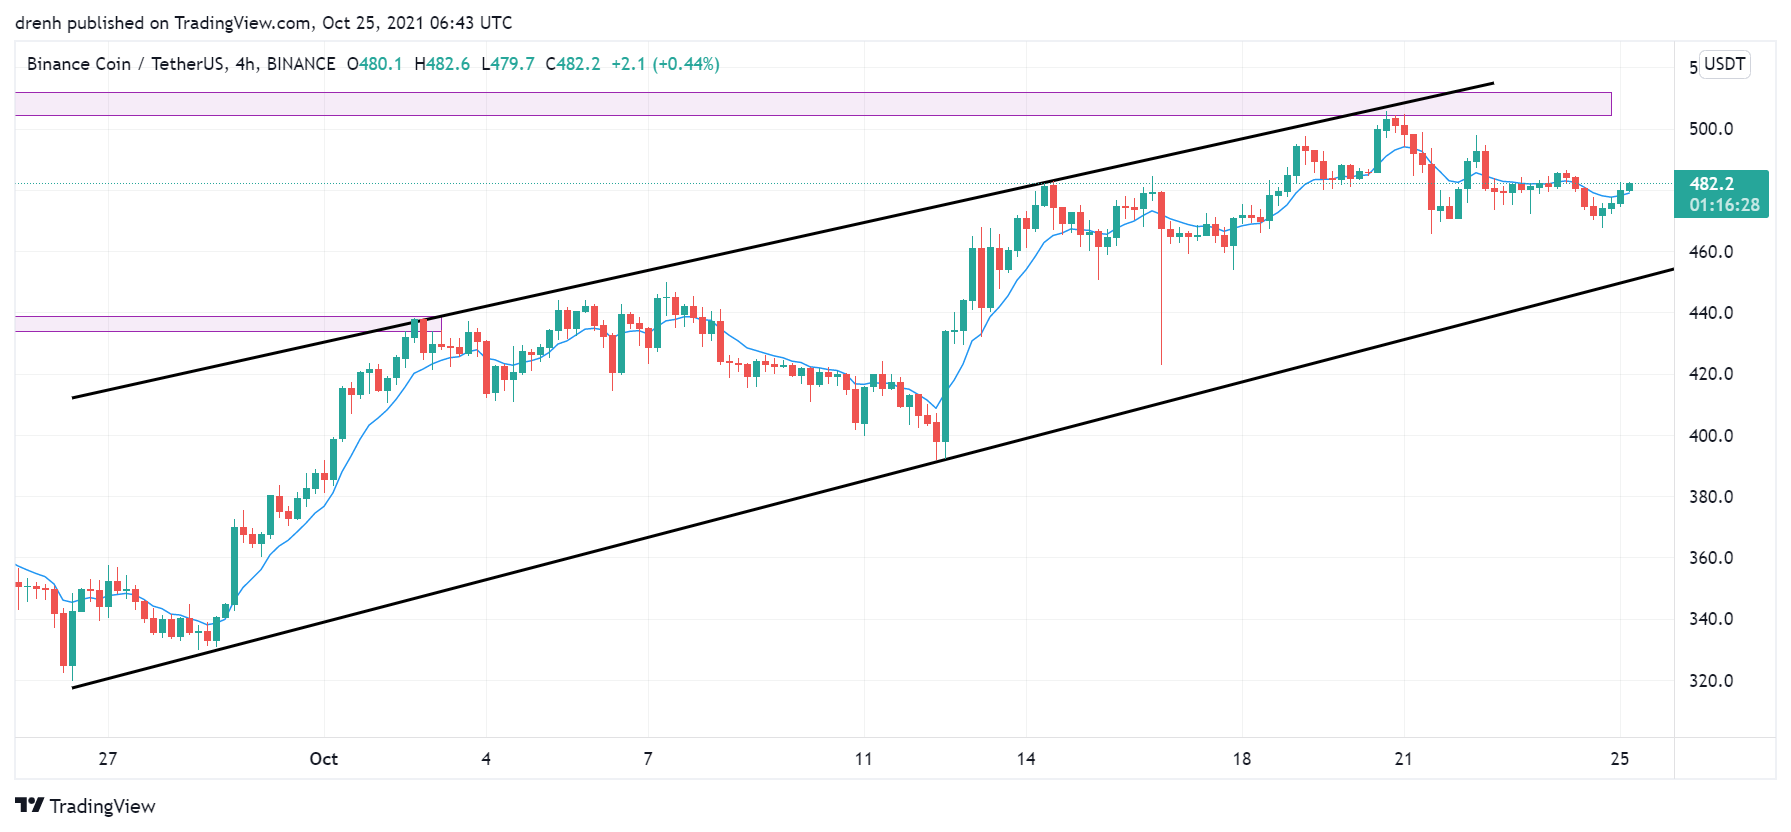
After increasing by 11% initially, the price has declined by 8% in the last few days. While it may suggest that the price is declining and may test support zones, the trend is still bullish in a 4-hour chart.
Daily Analysis
In the intraday chart, the price of BNB is bullish as well, as the price has increased by 3% in the last few hours. This indicates that the price can keep increasing in the coming hours.
Key Structures
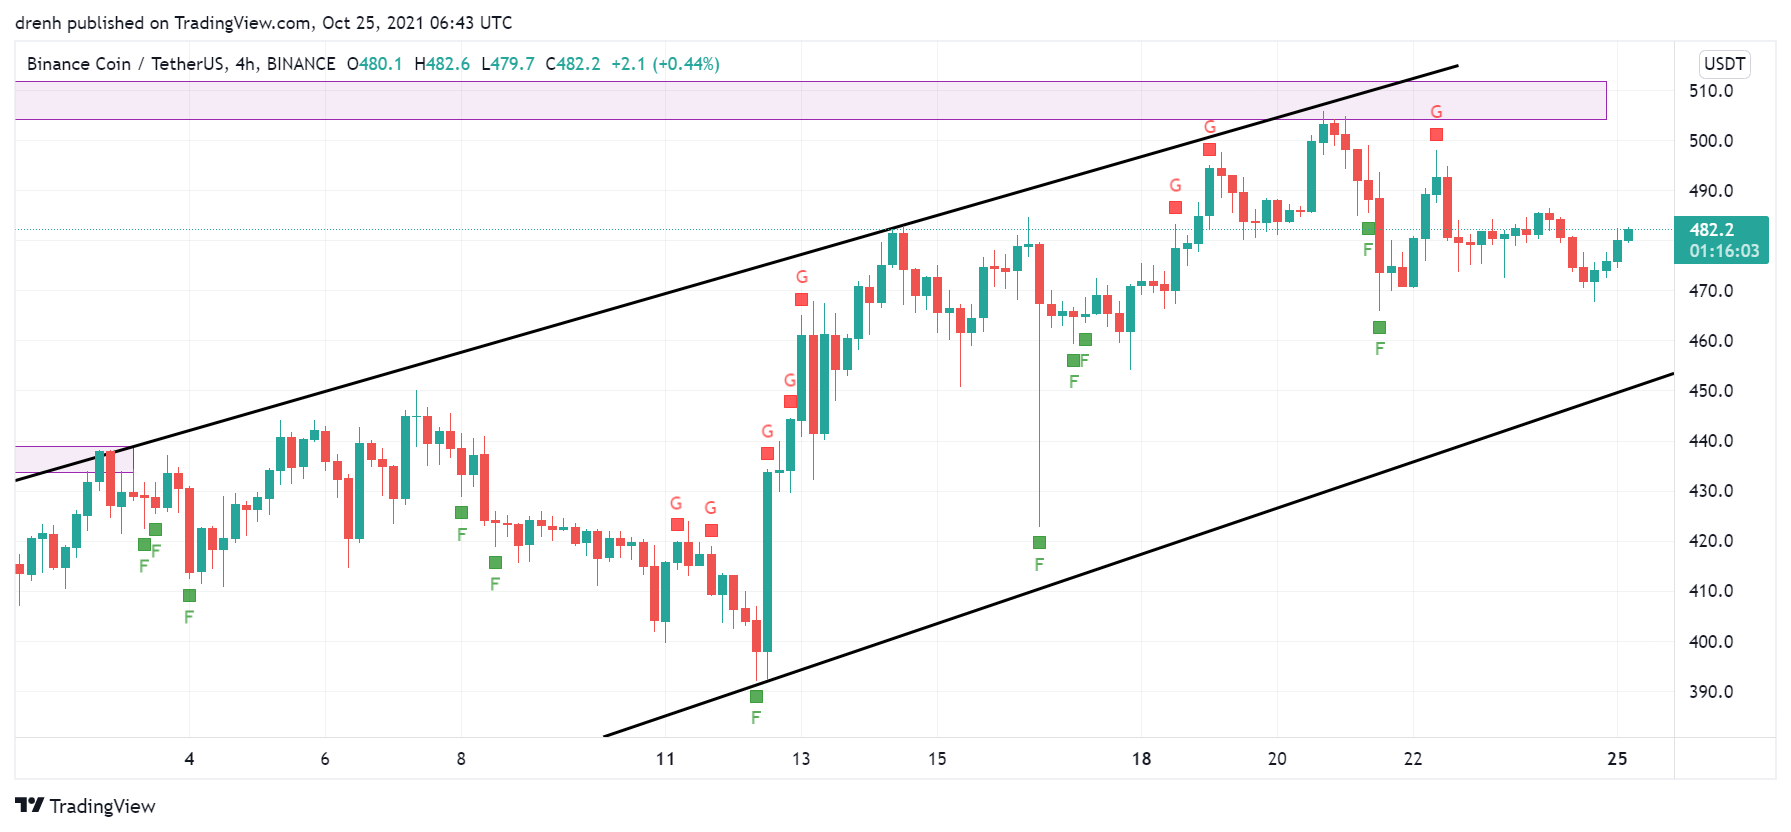
Support
- $466
Resistance
- $505
Indicators
Moving Average
The 20-day moving average is below the price, indicating that the trend is upward and that the price of BNB can keep increasing in the coming days.
The 9-day EMA is currently acting as a support structure, and it is slightly below the price. If the daily candlestick closes above the EMA line, then we could see a continuation of this trend in the short run.
Relative Strength Index
The RSI of a daily chart is on the rise, and it is slowly approaching 70, meaning that BNB is bullish. In a 4-hour chart, the RSI was recently near the oversold region, but it has started increasing again.
MACD
The MACD line has been above the signal line in a daily chart. However, the lines have converged, indicating that the momentum is changing and that BNB might become bearish. The opposite may occur in a 4-hour chart.
Fear & Greed
The fear and greed indicator in a 4-hour chart suggests that the current trend of BNB traders is greed, despite the recent price pullback.
Fibonacci
The Fibonacci retracement levels in a 4-hour chart suggest that the price of BNB is yet to retrace to one of the levels where it may find support. If that occurs, we could expect BNB to keep increasing in the short run.
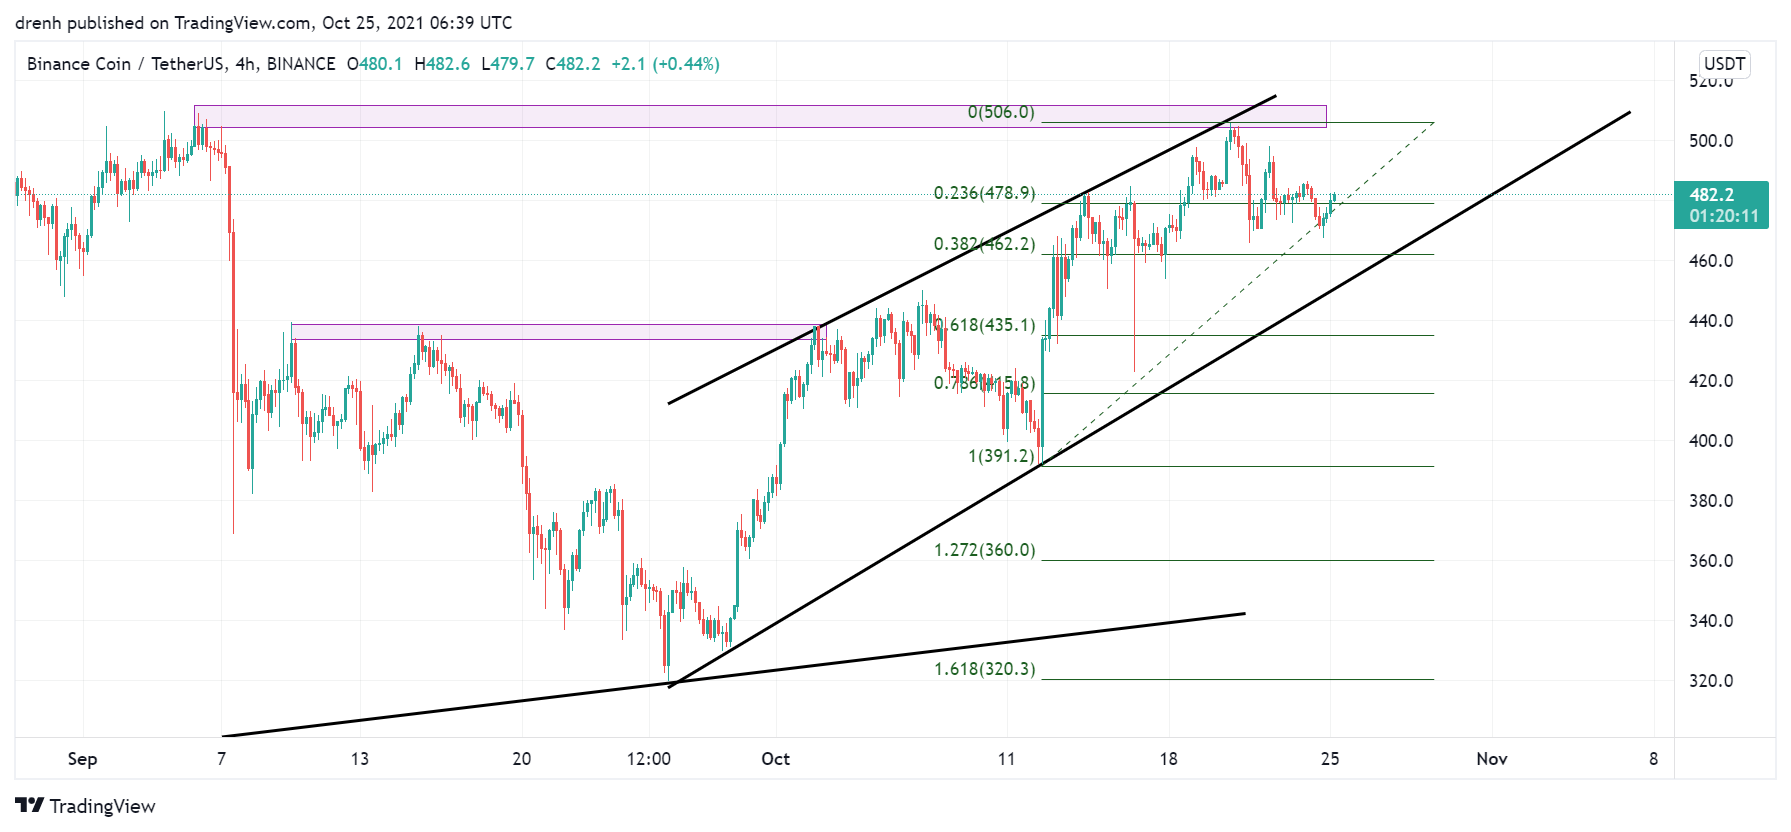
Price Prediction BNB – October 2021
Based on this technical analysis on BNB, we might see a retest of resistance at $505. If resistance is broken, then BNB might keep growing up to its all-time high in the coming weeks. If BTC maintains its momentum and keeps increasing as experts project, then we could see BNB reach up to $700 by the end of the year.
Latest News for BNB – Affecting Price
A recent proposal in the Binance ecosystem entails that BSC fees should be burned. As a result, BNB becomes more deflationary, and its price may easily increase. Furthermore, the price of BNB has been increasing due to the increasing volume of the Binance Exchange. This implies that the price can keep increasing if trading volumes increase as the bull cycle intensifies.
Also read: Binance Coin Price Prediction 2021 and Beyond – Will the BNB Price Surge Upwards?