


BTC Technical Analysis – November 2021
Monthly Analysis
Over the last month, BTC has increased by around 64%. It reached a new all-time high at $67,000, and it then has started retracing. The trend is still upwards and BTC remains bullish for the remaining months of 2021.

Weekly Analysis
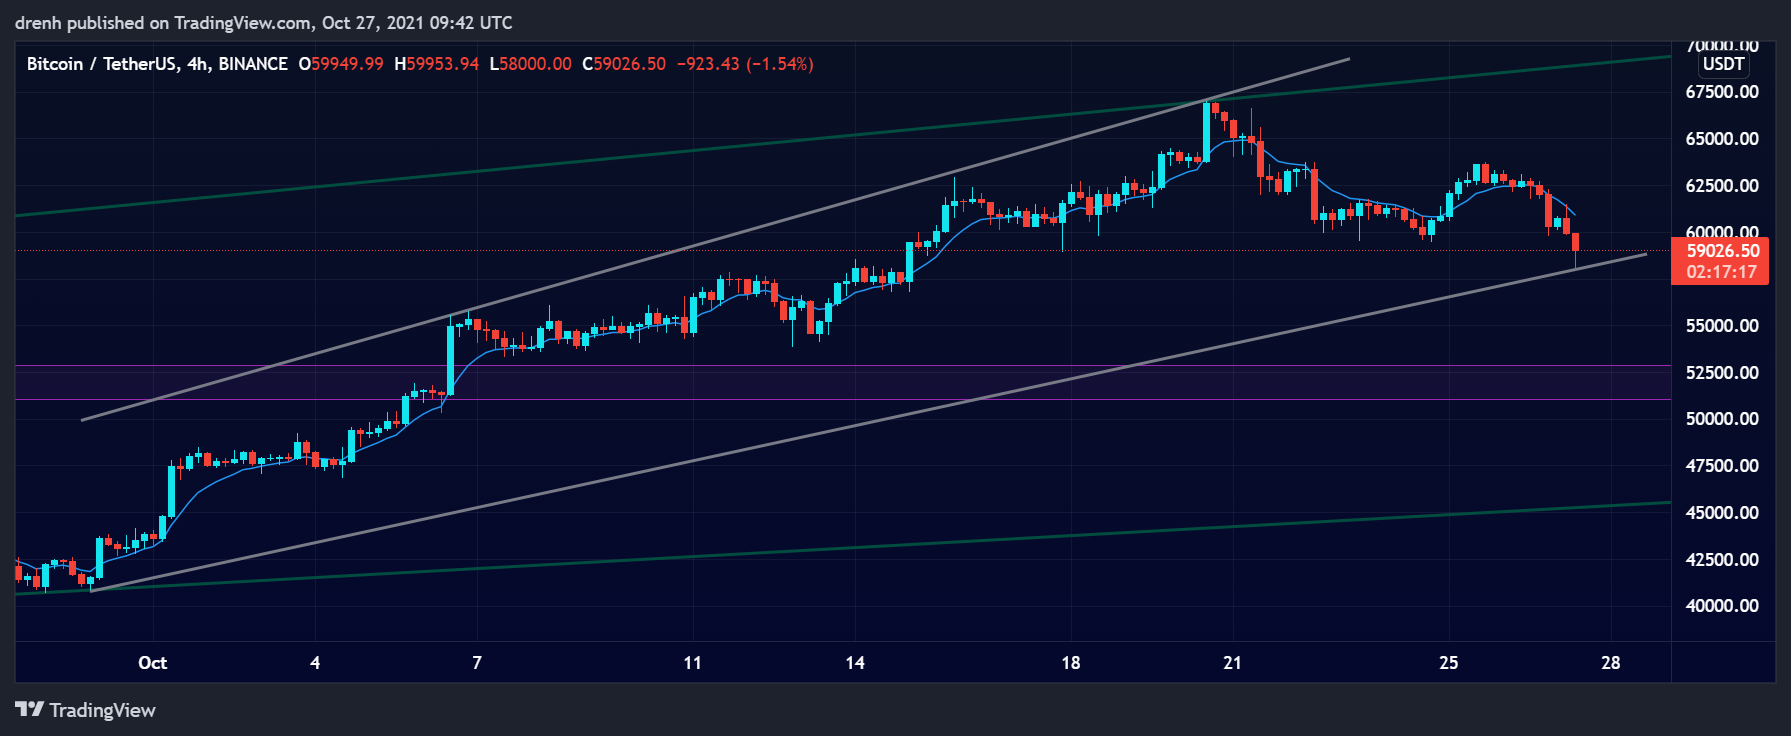
In the last 7 days, BTC has been bearish, and its price has declined by around 13%. Based on this pattern, the price could keep declining in the coming days. However, BTC is still bullish.
Daily Analysis
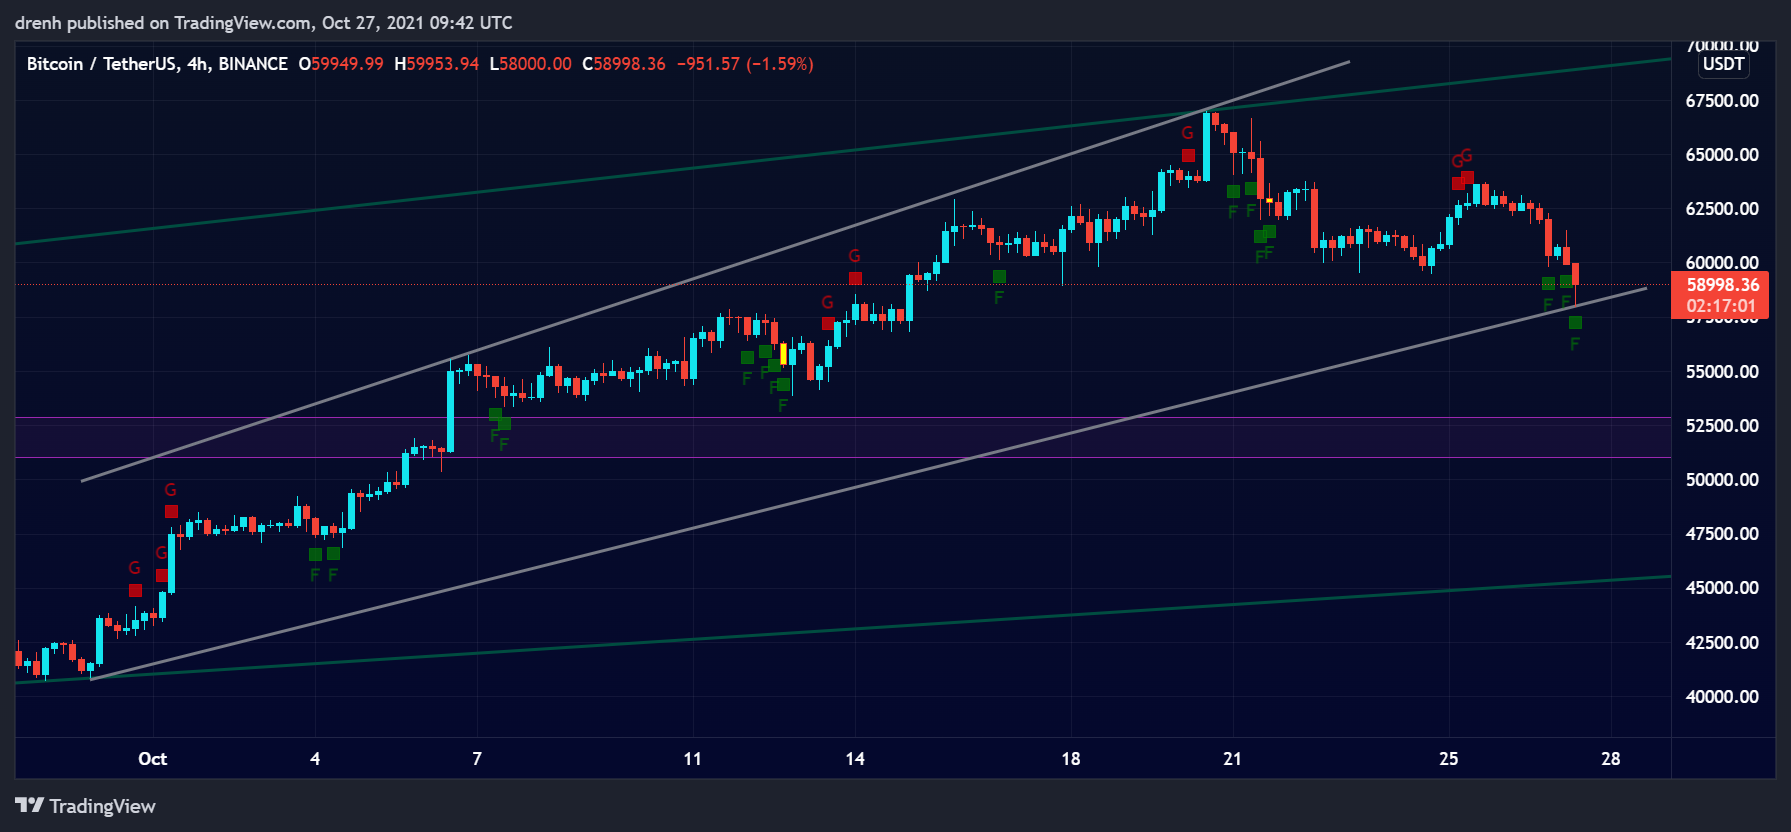
In the intraday chart, the price of BCH has declined by more than 5%. This indicates that the price of BTC could keep declining in the coming hours. It may soon find support in the short run.
Key Structures
Support
- $53,000
Resistance
- $63,700
Indicators
Moving Average
The 20-day moving average has now moved above the price, meaning that the trend may now be downward and that the price of BTC can keep decreasing in the coming days.
The 9-day EMA is also above the price and may act as resistance to the price of BTC in the coming days.
Relative Strength Index
The RSI of a daily chart was recently in the overbought region, suggesting that the recent price dip was expected. In a 4-hour chart, the RSI is approaching 30 and becoming oversold.
MACD
The MACD line is below the signal line in a 1-day chart, indicating that the momentum is now bearish for BTC. In a 4-hour chart, the MACD line is even lower.
Fear & Greed
The fear and greed indicator of a 4-hour chart suggests that the current emotion of BTC traders is fear.

Fibonacci
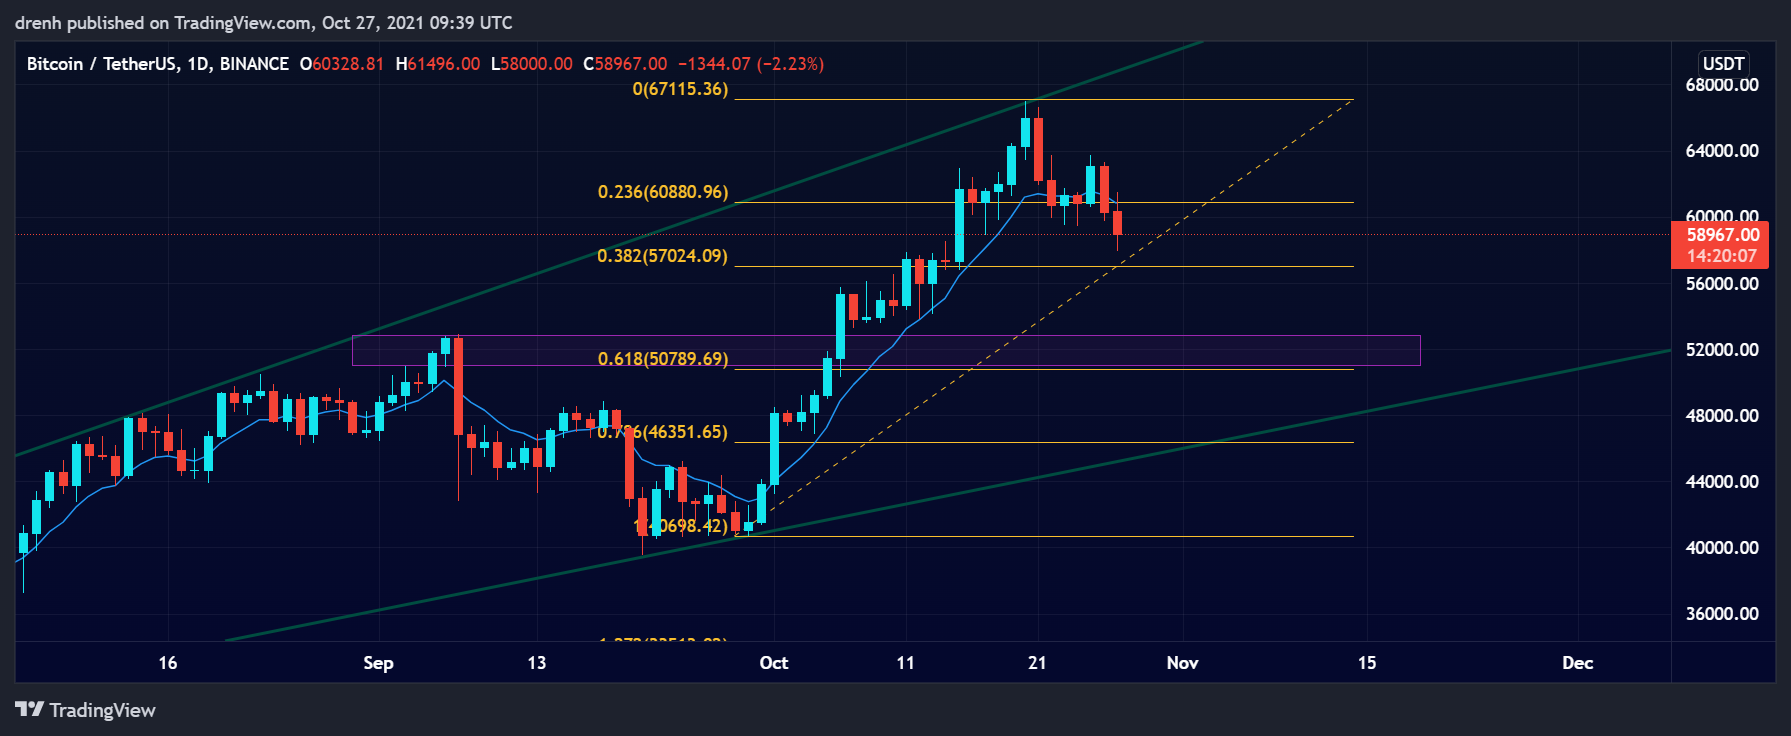
The Fibonacci retracement levels suggest that the price could potentially retrace down to the 61.8% level in the coming days. If it finds support there, the price of BTC can surge upwards.
Elliott Waves
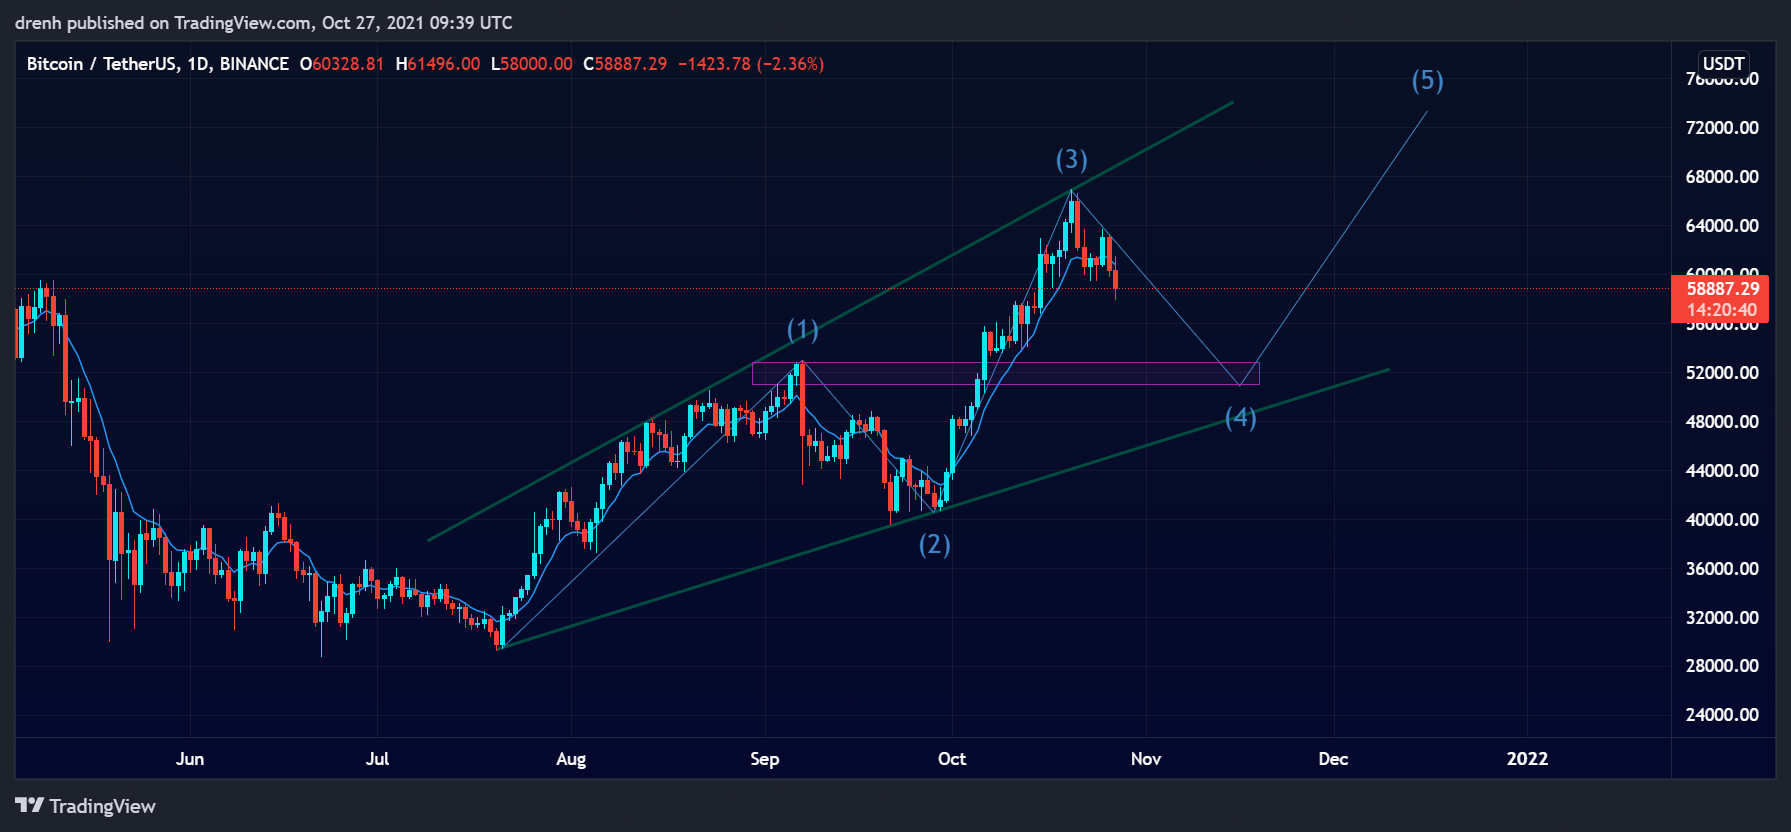
If BTC finds support at the projected structures, then the Elliott Waves pattern could take shape, as BTC is expected to increase in the coming days.
Price Prediction BTC – November 2021
Based on this technical analysis on Bitcoin (BTC), we could see its price increase above $70,000 in the coming weeks if it finds support at the 61.8% level. Nonetheless, BTC can decline close to $51,000 before going up again. Some believe that the bull cycle might already be over. Richard Heart has recently predicted that BTC could decline as low as $10,000.
Latest News for BTC – Affecting Price
Tesla has recently announced that it will start accepting BTC payments again. Such announcements from the likes of Elon Musk can have a positive effect on the price of BTC in the coming weeks.
Also read: How Much Will Be Bitcoin Price In 2025 – Bitcoin Analysis 2025