

BTC Technical Analysis – January 2022
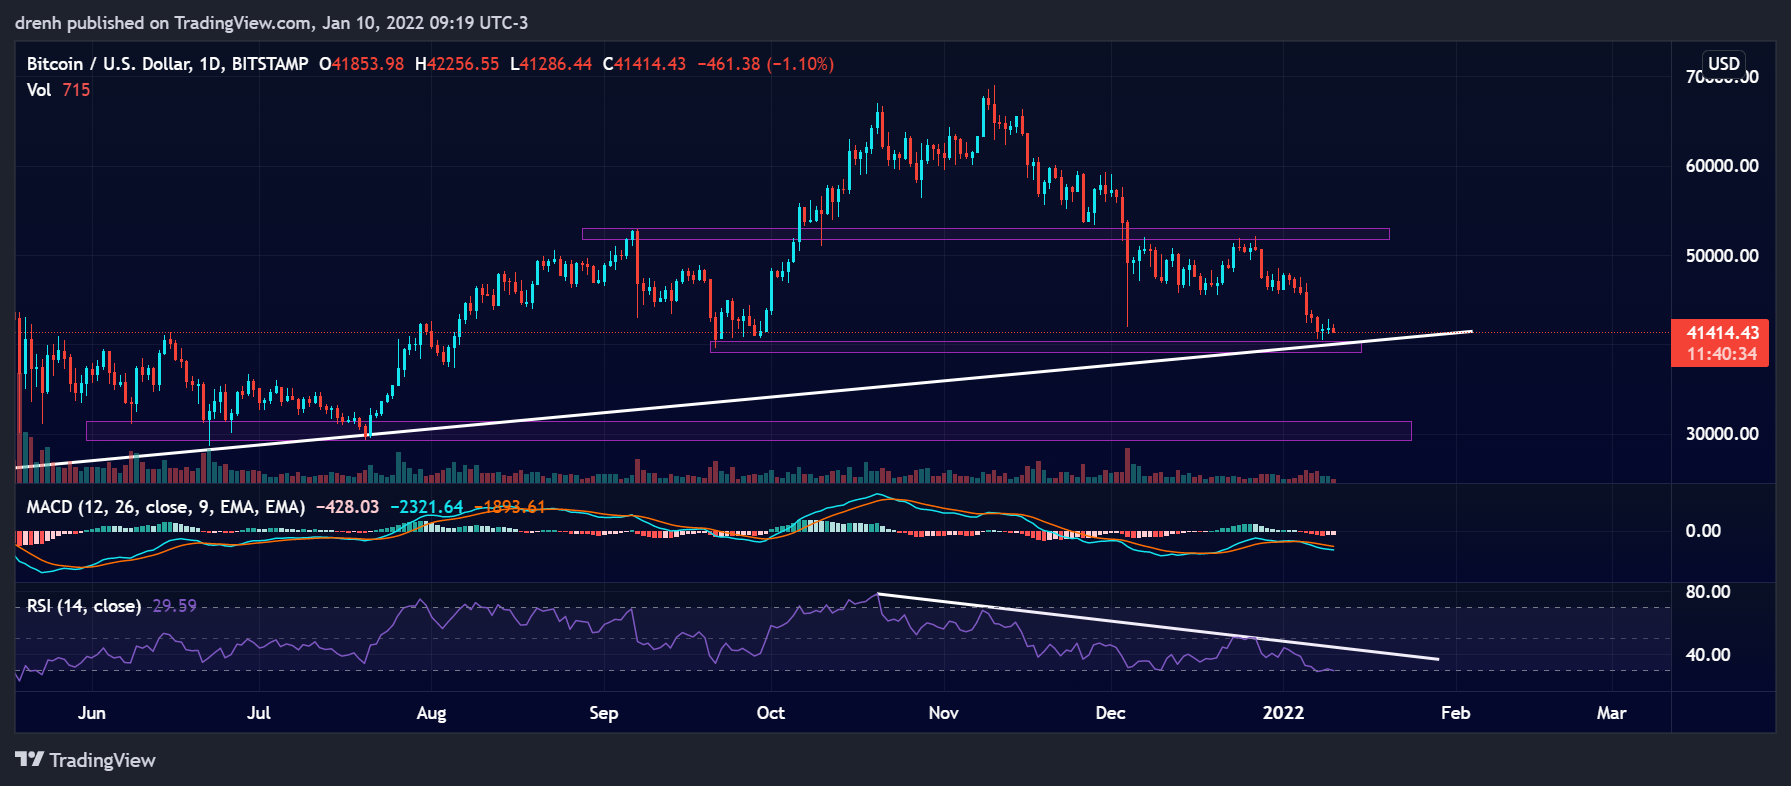
After hitting an all-time high at around $69,000 in November, the BTC/USD chart took a different route. The price has declined by around 42% after that, indicating that BTC could be heading further down, other things equal. Nonetheless, BTC is now facing crucial support at around $39,500, which could prove t be one of the last hopes for BTC to maintain its bullish nature throughout 2022.
In 2022 alone, the price has declined by 16%. Experts, analysts, and various crypto influencers believe that this may be the start of a crypto winter, which could last months and even years.
But still, looking at the chart on this day a year ago, BTC was trading a little above $30,000, where signs of extreme greed were appearing. Nonetheless, with a higher value than last year’s, the current fear and greed index is showing signs of extreme greed.
Key Structures
Support
- $40,000
Resistance
- $48,500
Indicators
Moving Average
As the 20-day moving average diverges further from the price of BTC, the downtrend is more potent than ever. Even if BTC attempts a correction in the coming days/weeks, the MA line could play a role as a potential resistance structure.
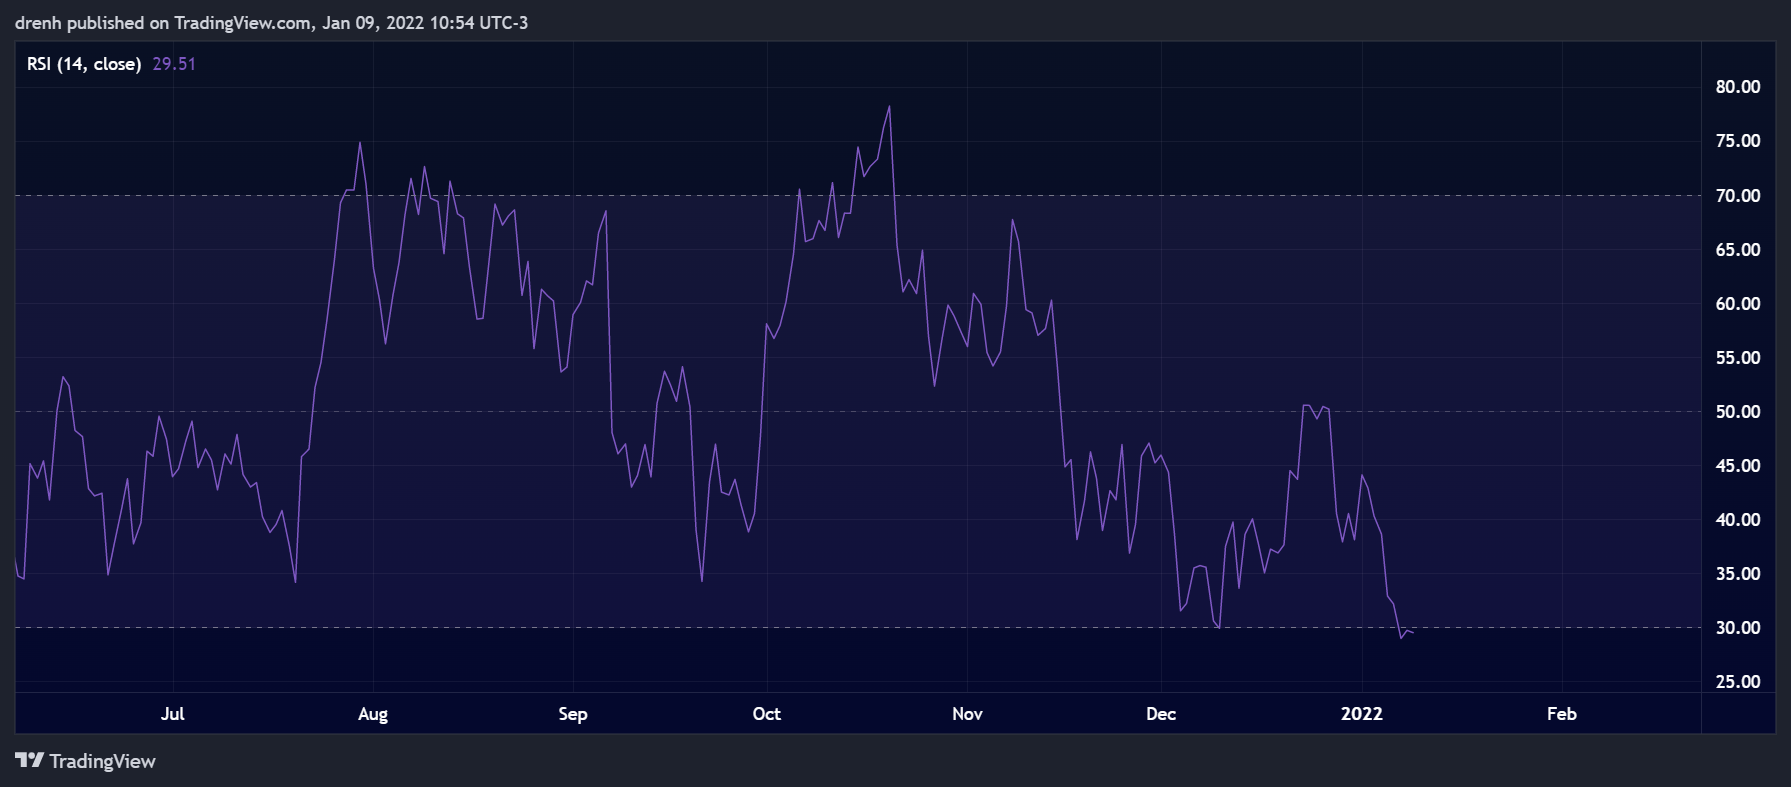
Relative Strength Index
The RSI of a 1-Day chart has finally touched slightly below 30, indicating that BTC is currently being oversold. On a bullish note, we could see BTC reverse in the coming weeks, where we would see the RSI adjusting and aim for 70 once again. On a bearish note, a downward trendline of the chart could see the RSI go up to 40 at most.

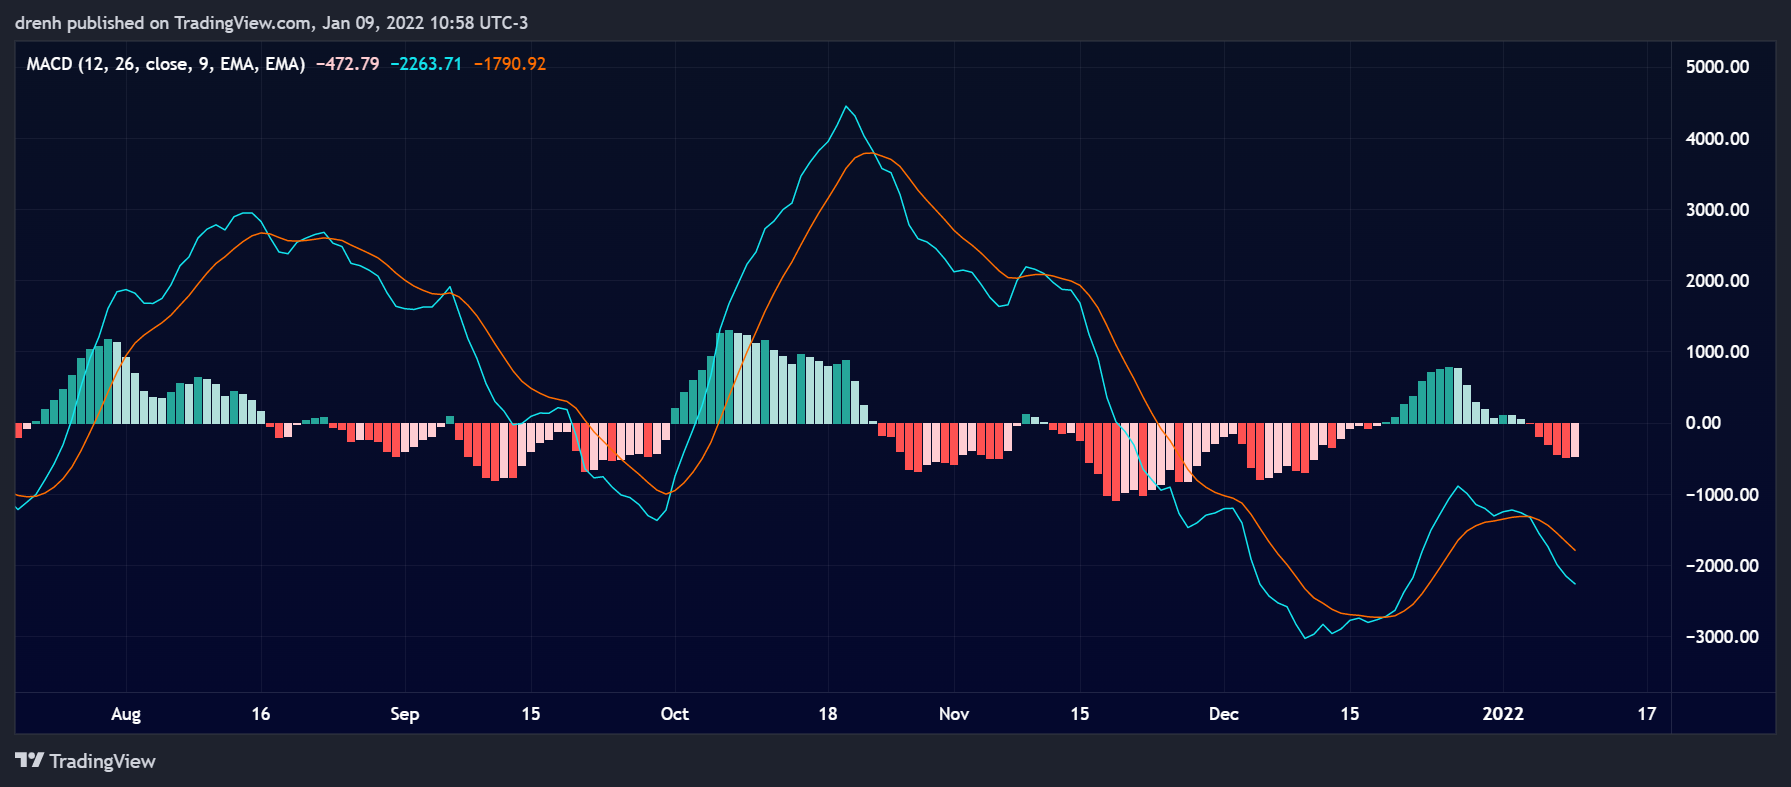
MACD
With that in mind, the Moving Average Convergence Divergence shows signs of a strong bearish momentum as the MACD line is well below the signal line and the baseline. Unless BTC finds support soon, the lines are unlikely to converge and attempt a momentum change.
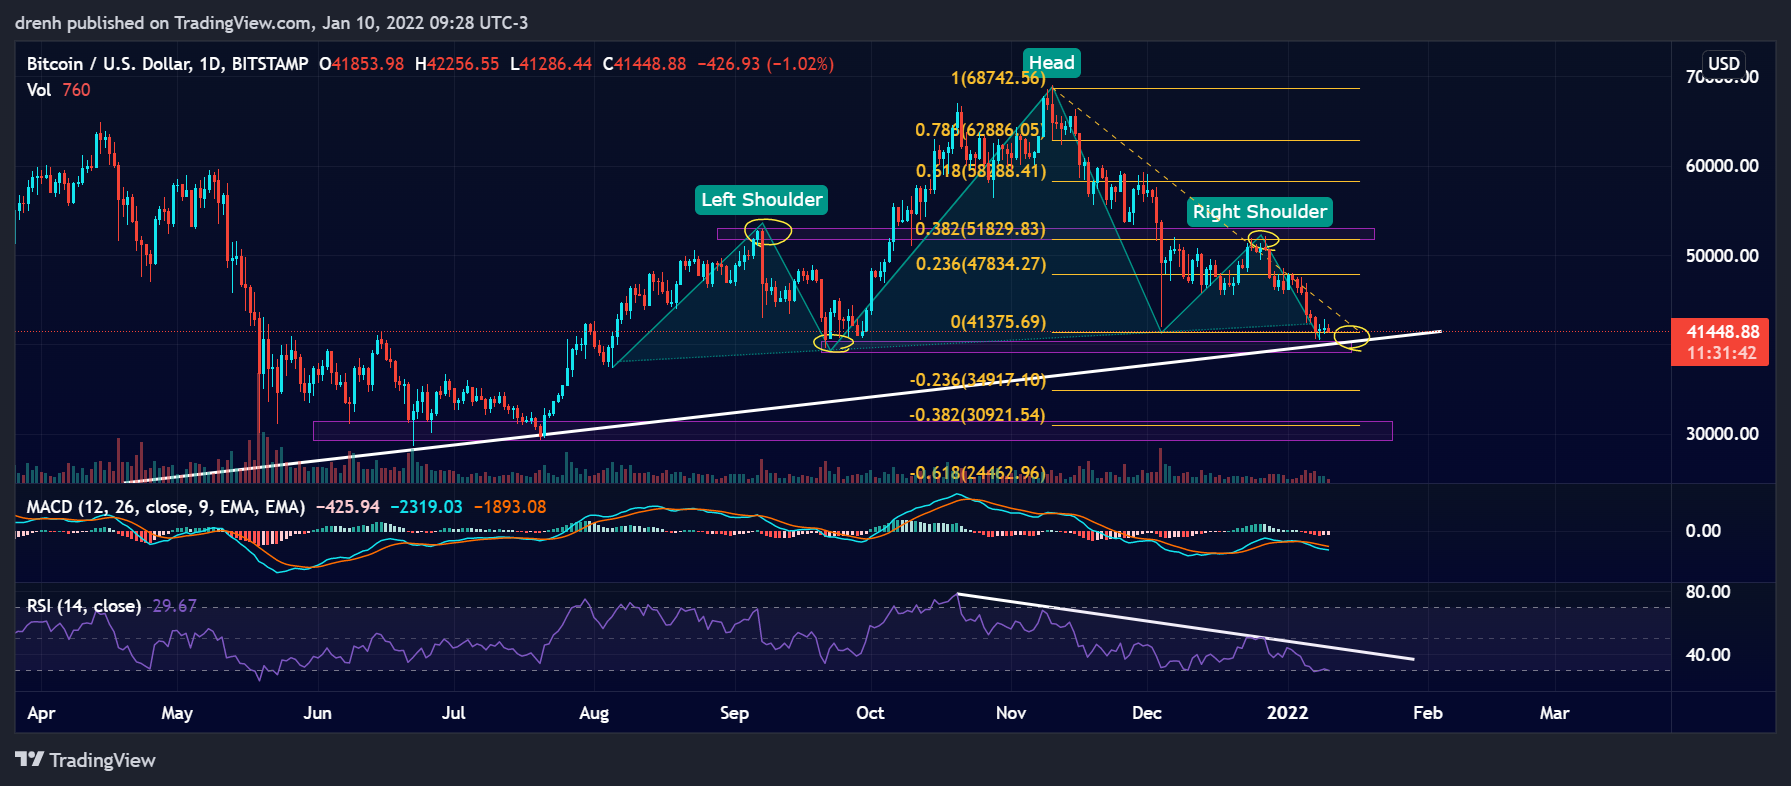
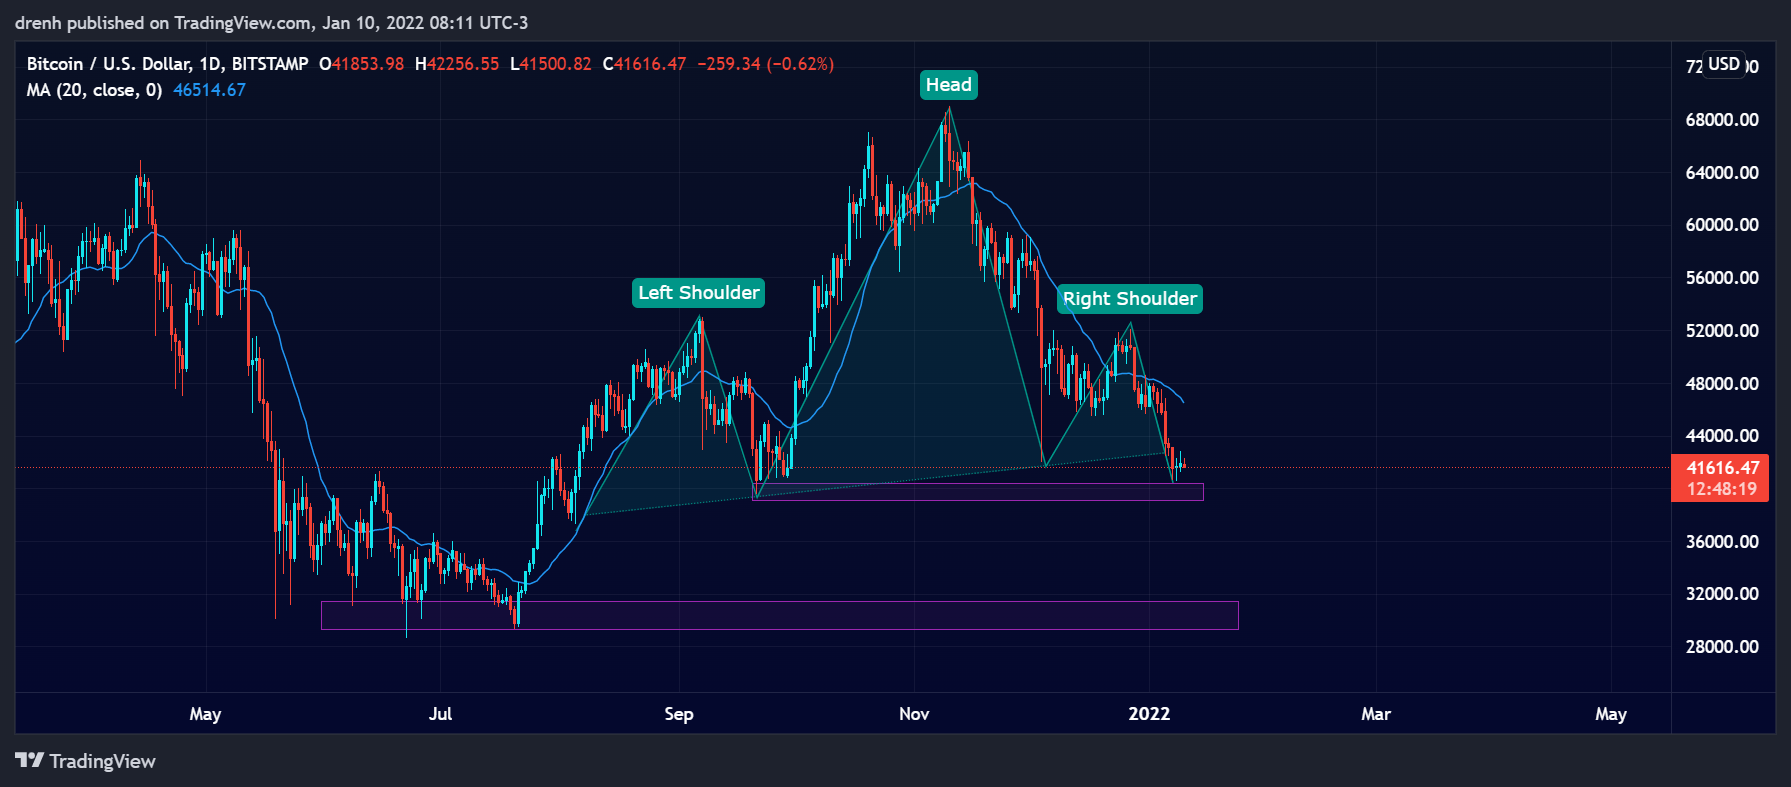
Head and Shoulders
When looking at the 1-day chart, a head-and-shoulders pattern has emerged as BTC has slightly penetrated the neckline. Unless the price finds support soon and has a correction upward, we could see BTC head further down and potentially below $30,000 in the coming weeks.
Fibonacci
The Fibonacci retracement levels of a 1-day chart suggest that if and only if BTC finds support at the $40,000 zone, the price could potentially impulse upward to the 38.2% level, other things equal. That level could prove to be a strong level of resistance at around $53,000.
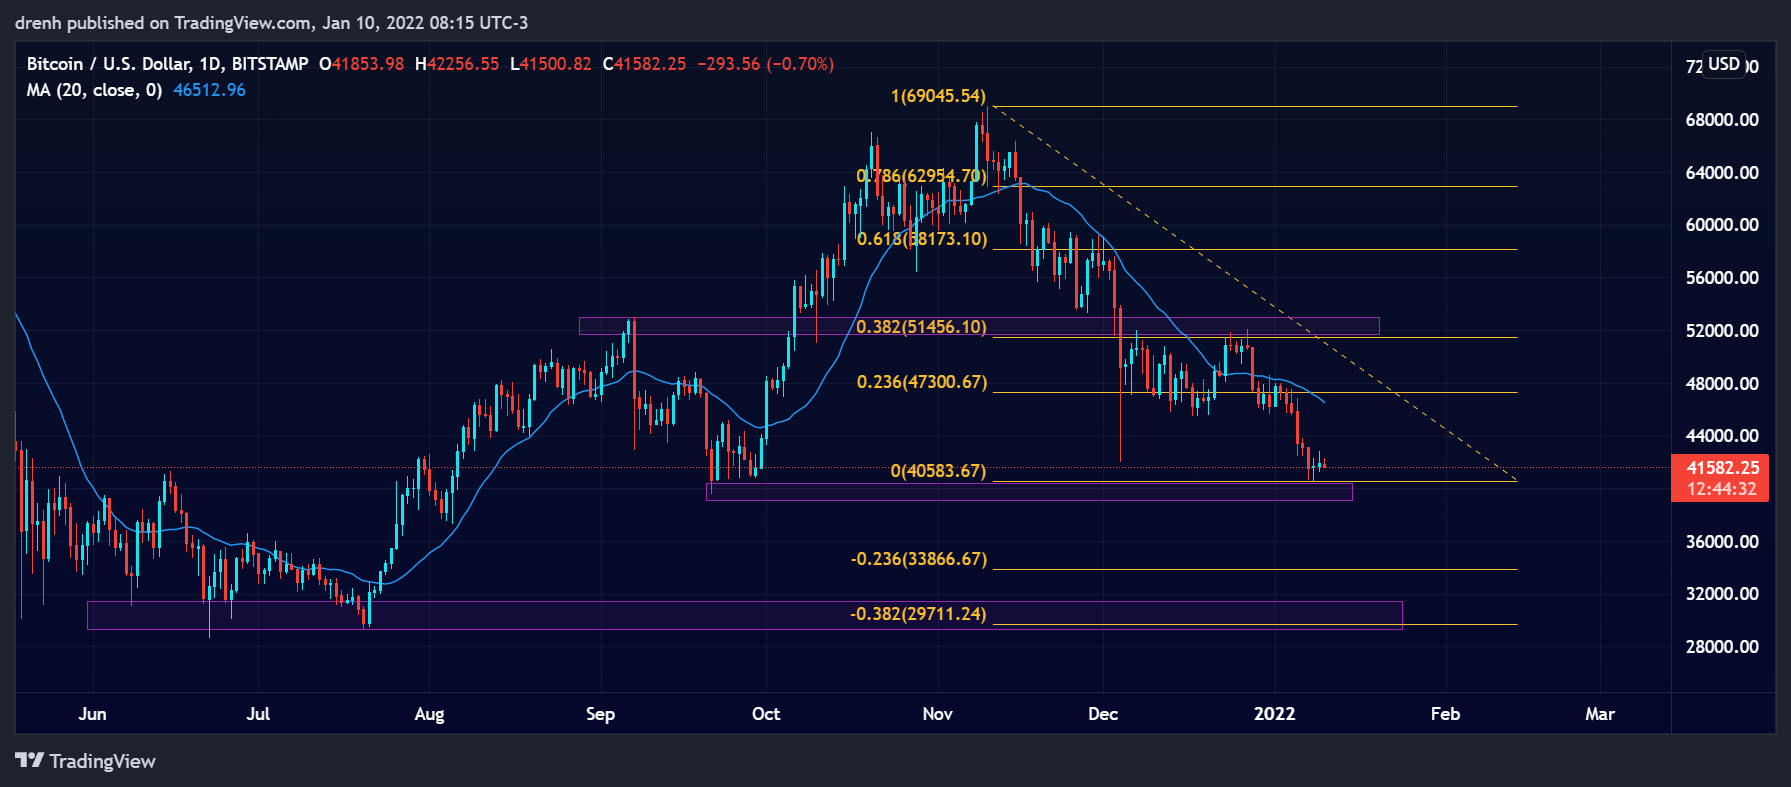
BTC/USD 1-Day Chart Fibonacci Levels
Price Prediction BTC – January 2022
If BTC finds support at $40,000, then we could see yet another leg of this bull run in the coming week. If it does not, then the price could be heading further down as the bearish market could intensify.
Latest News for BTC – Affecting Price
The Federal Reserve has recently stated that the interest rates may increase soon and that some assets might be sold to keep the balance sheet stable. This has caused an alarming view of the market as the selling index has shown huge momentum in the last few days.
Ivan on Tech has also admitted that there is hardly any way to correctly predict what is going to happen next. He also acknowledges the strong support that BTC could have at the crucial structure mentioned above.
https://www.youtube.com/watch?v=VIWrDctA6mY
Ivan also references Cheds from Twitter, which had accurately predicted how much BTC was going to go and how low it can dump.
IMO if true, rip to 64k or just above and then reject because this move is already baked in. Then dump to 40-42k level
Scare new retail then continue up
— Cheds (@BigCheds) October 14, 2021
Also read:
Kosovo Crackdown on Miners Continues: Over 300 Crypto Mining Machines Seized
Solana Blockchain Encountered a Degradation of Network Performance Twice This Week
After a Backlash, the Mozilla Foundation Reconsiders Accepting Cryptos
Active Users in the Cardano Network Increase by 50%
Three of the Biggest BTC Whales Acquire More than 5,300 BTC
Bitcoin Could Outperform Gold in Market Shares, According to Goldman Sachs