

Bitcoin price movement has really been shaky, and there is only one reason, high inflation rates across the globe. Our Bitcoin price analysis dives into the current price movement, the movement pattern, and the possible outcome.
Inflation has hit the global hard after the global recession during and after the COVID-19 pandemic. The trend has really shifted from hodlers and daily traders making their careful moves with the liquidity pools in play.
The liquidity pools are now driving the cryptocurrency economy, offering high yields. The cryptocurrency realm has now reached a new era where those who called it a bubble are about to become the biggest market gurus. While those who called it a gamble won’t be far behind either.
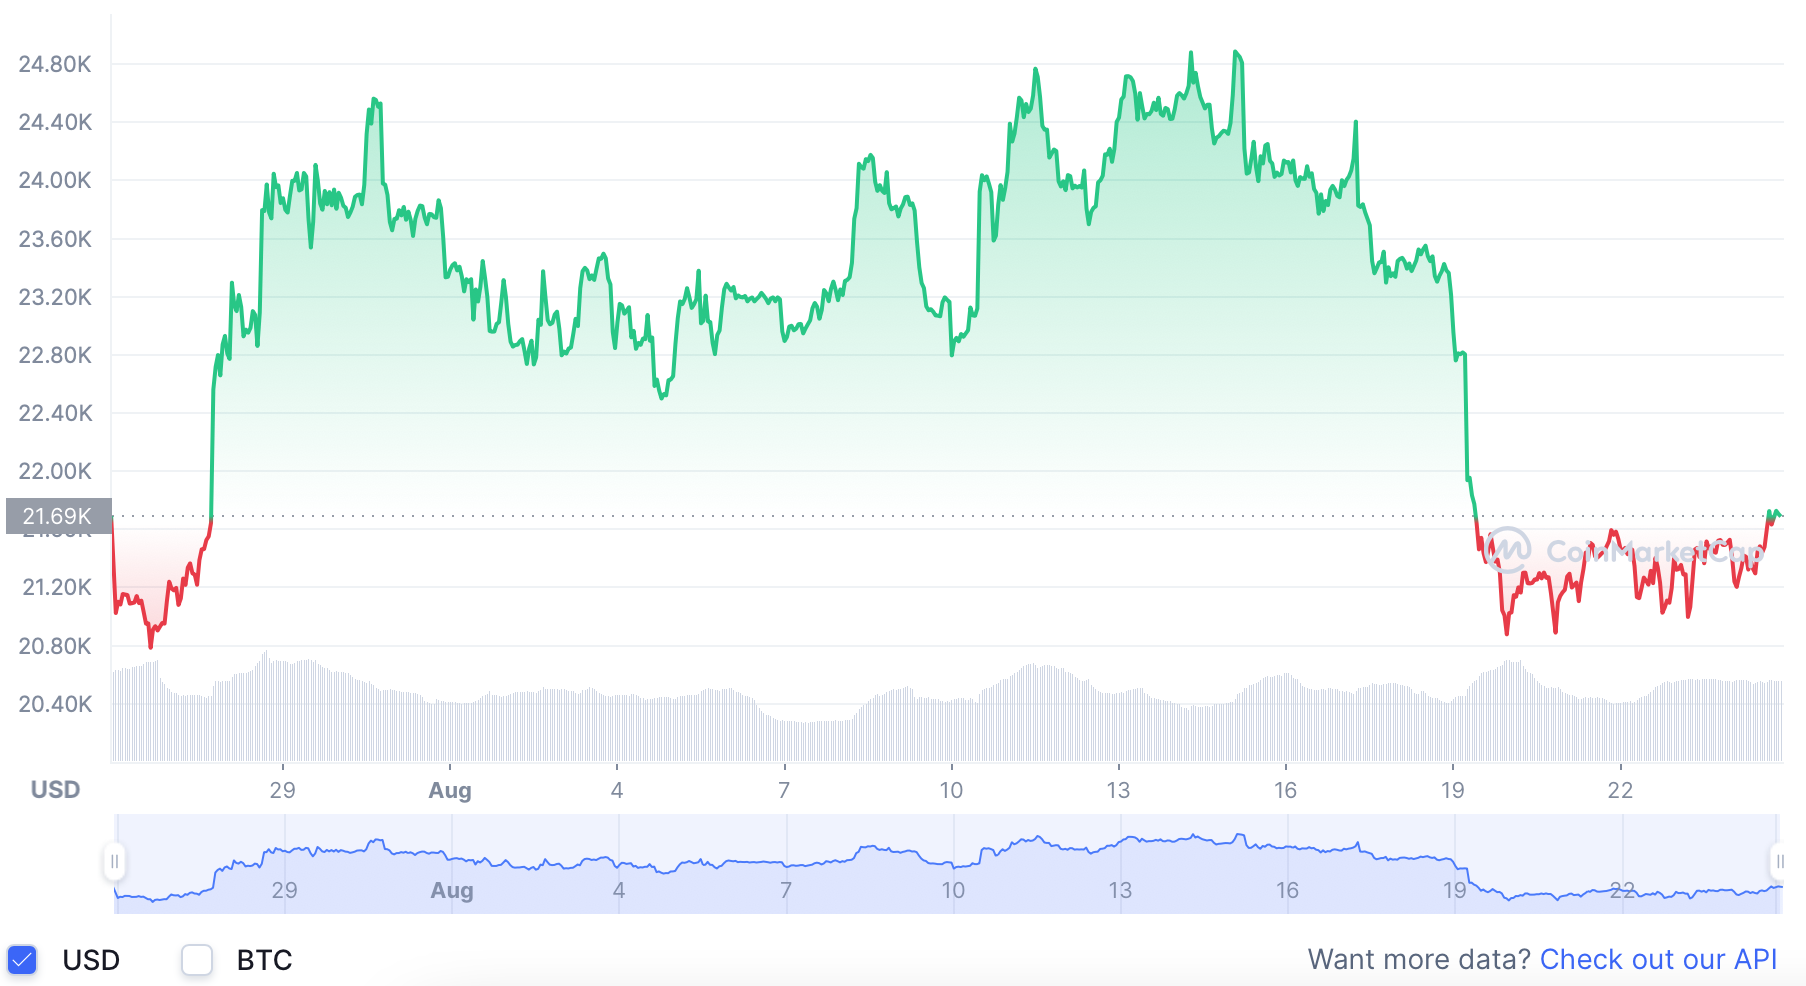
Bitcoin price chart by CoinMarketCap

Bitcoin price managed to reach the $24,400 mark at least four times in the past 30-days. The longest it managed to stay above the mark was from the 13th to the 15th of August, 2022. The 14th of August was an overall market high owing to the excessive buying trend.
Bitcoin Price Analysis: Bitcoin in a possible reverse head and shoulder
Bitcoin price moved into a reverse head and shoulder movement from the 18th of July till the 3rd of August 2022. However, instead of playing out the possible outcome as seen with the head and shoulder movement, the coin did not show any bullish momentum owing to the constant heavy selling to yield profits. BTC price went into another smaller reverse head and shoulder on the 8th of August, this time to rise beyond the $2,4800 mark.
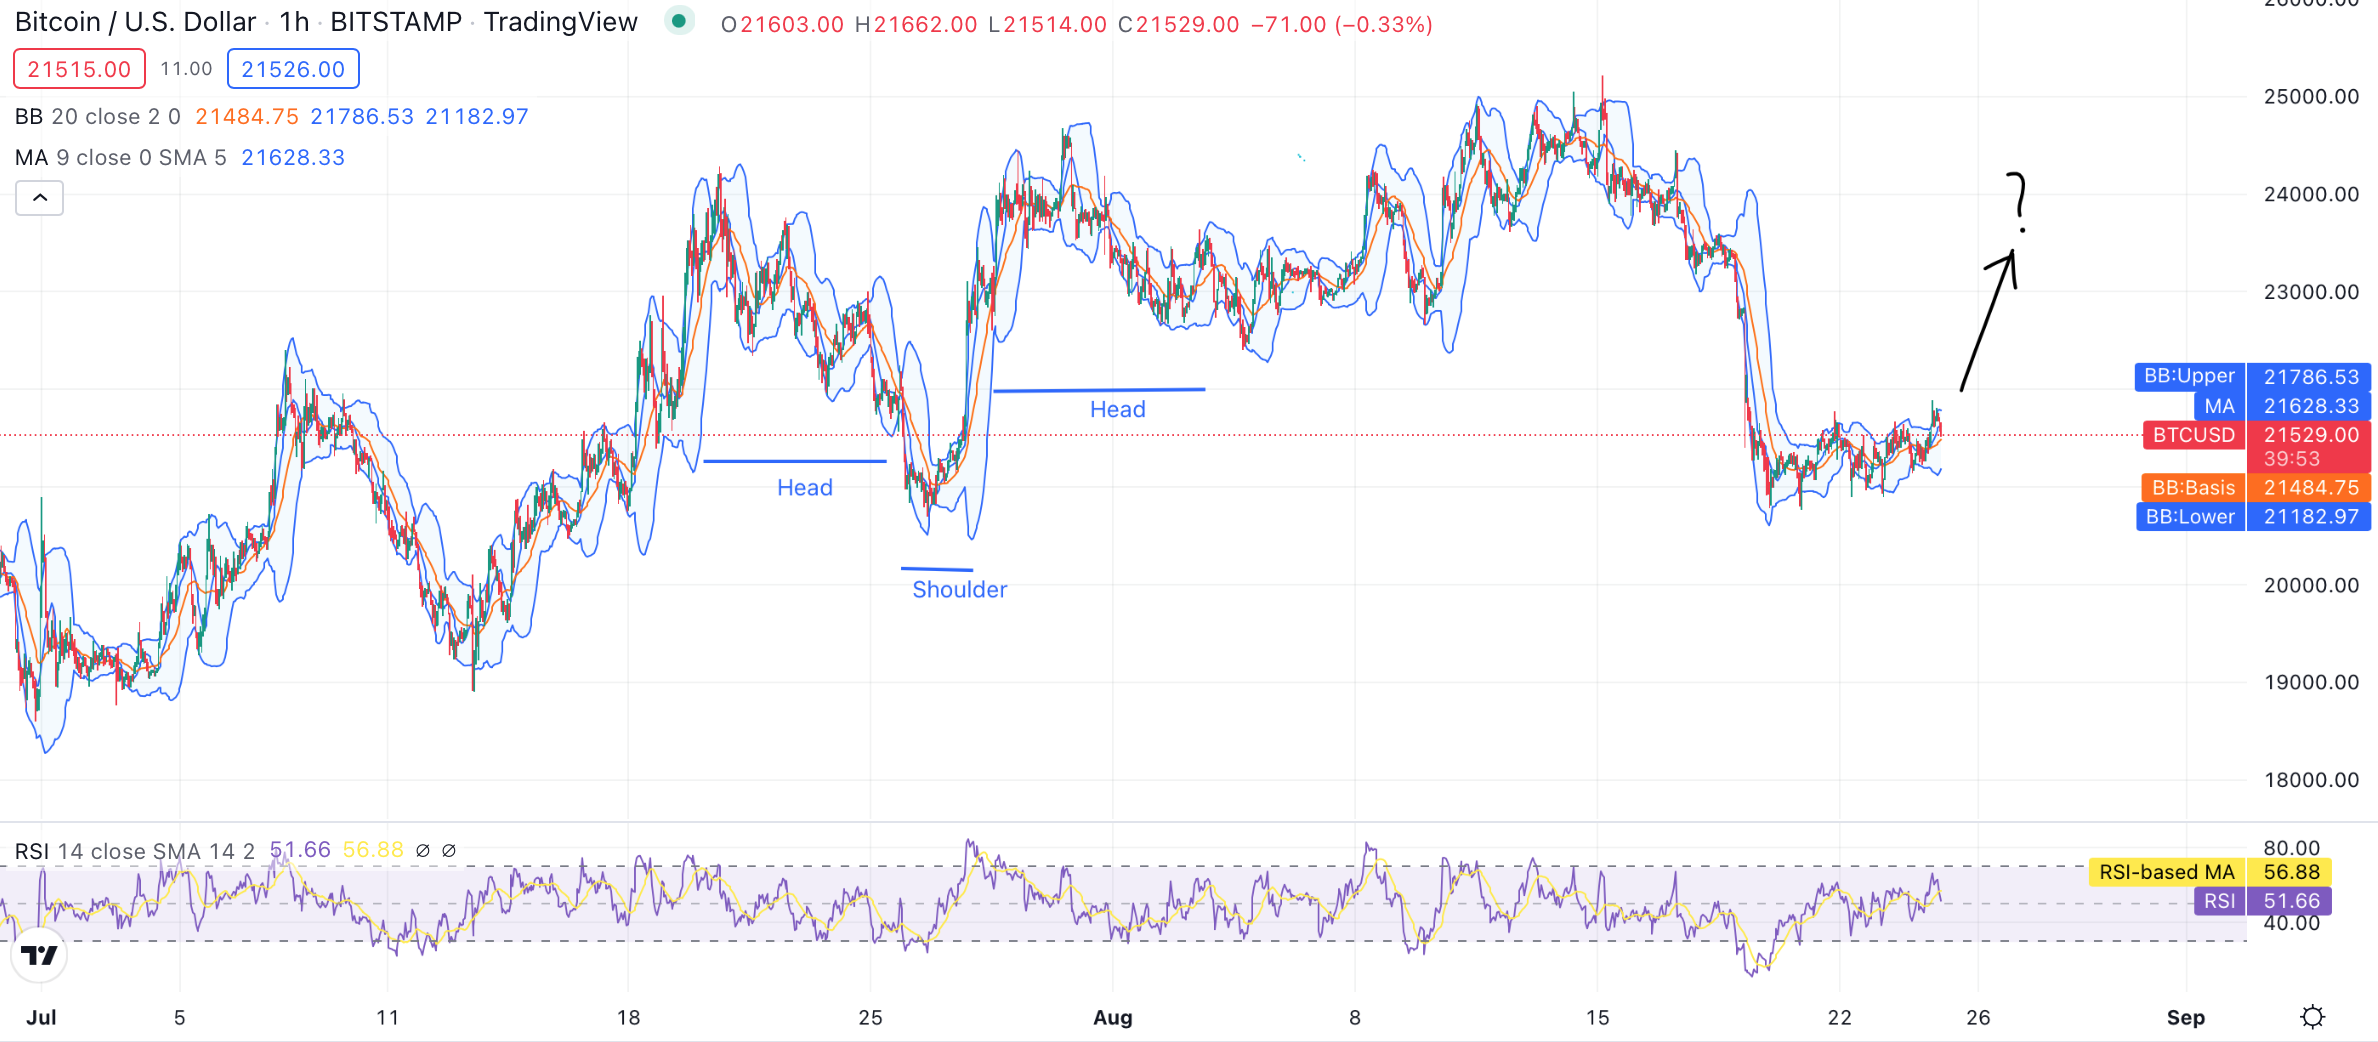
Bitcoin price analysis chart made with TradingView

The 8th of August reverse head and shoulder is evident on the relative strength index chart as well, where the buying and selling trend is translating into the movement on the price chart. At the time of writing, Bitcoin price movement is entering what appears to be another reverse head and shoulder movement, with the strongest support found at the $20,783 mark.
The current movement started with a flash drop from the $23,000 to the $20,900 range on the 18th of August. Moreover, the price took a good seven days to stabilize, while the RSI score also shows a stable buying and selling trend.
At the time of writing, the RSI score stands at 51.56, and the RSI moving average (MA) stands at 56.88 score. Bitcoin is showing bullish tendencies, with the MA posing first resistance at the $21,628 and the Bollinger Bands upper limit at the $21,786 mark posing the strongest resistance.
Strong support is found at the Bollinger Bands average (BB: Basis) at the $21,484 mark, while the strongest support indicator is Bollinger Bands lower limit at the $21,182 mark. Although the overall strongest support, as mentioned earlier, is found at a much lower point.
The current possible pattern will take a few weeks to form, and once fully formed; the indicators will tell the next possible movement. However, at the time of writing, a reverse head and shoulder movement and a rise towards the $24,000 mark is highly likely. Traders are advised to tread with caution.
TakeAways
- Bitcoin price after the inflation market trend is unstable owing to the buy/sell trend.
- Bitcoin price is stabilizing after a flash drop, moving into a possible reverse head and shoulder.
- The current buy/sell trend is the major factor swaying the price.
- Bitcoin price is likely to get past the current barriers and towards the $24,000 mark.
- Traders must use caution while trading.
Disclaimer: The information provided on this page is most accurate to the best of our knowledge; however, subject to change due to various market factors. Crypto-Academy encourages our readers to learn more about market factors and risks involved before making investment decisions.