
- Bitcoin’s recovery began from the $30,000 price mark and has since raced into $46,000.
- The king coin could retrace to $44,000 before moving further upward.
- As BTCUSD progresses steadily, we could see a breakthrough of $46,800.
BTC/USD bullish recovery move progresses steadily. The rise of Bitcoin from the great dump that occurred during April and May began from the $30000 price mark and has since raced into $46,000, making significant gains. The King coin’s bullish progress is steady and looks to cover more ground before continuing upwards.
Key Levels
Resistance Levels: $41,000, $46,800, $52,000
Support Levels: $30,000, $37,500, $42,500
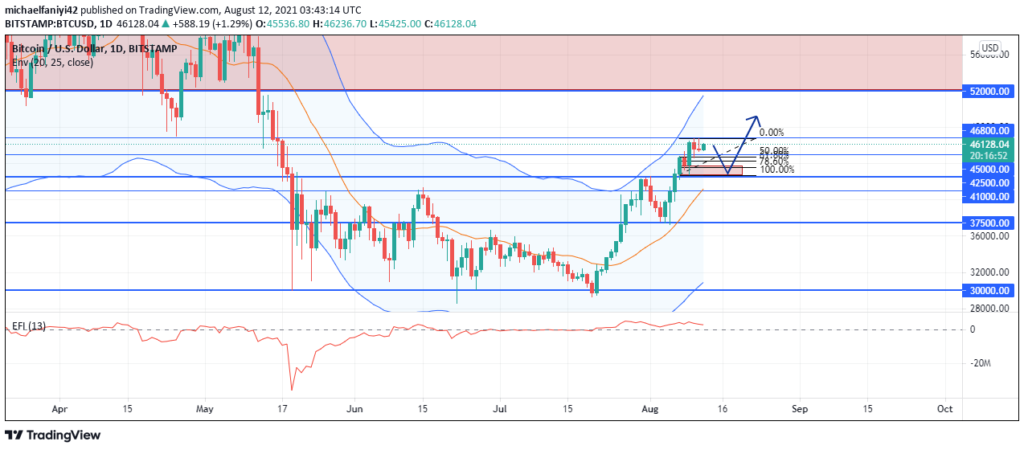

On the daily chart, BTC’s bullish move started on the 21st of July, when the cryptocurrency dipped into the $30,000 support mark and started to rally steadily from there. The bullish move, which started with initial public skepticism, soon confirmed itself as it broke through the $41,000 solid resistance area. The price was retraced on 3rd August to retest the resistance area it broke. The retest was completed successfully at $37,500 as the price found support at this level to rally further for four days to $45,000 before showing any signs of weakness.
Analyzing the EFI (Elder Force Index) on the daily chart, we observe the red force line has been steadily sustained above the zero marks. This is despite the dips that occurred from 31 July and 3rd August. This shows us that there is a reinforced bullish force holding this rally up. Signs like these serve as positive indications of a sustained bullish run-up.
Although price is yet to trade above the upper channel level of our Envelope indicator, the dip in price from the 31st of July to the 3rd of August shows us that price actually dipped to the middle of the channel’s EMA (Exponential Moving Average), and rallied off there. This indicates signs of a healthy retracement amid a trending market.
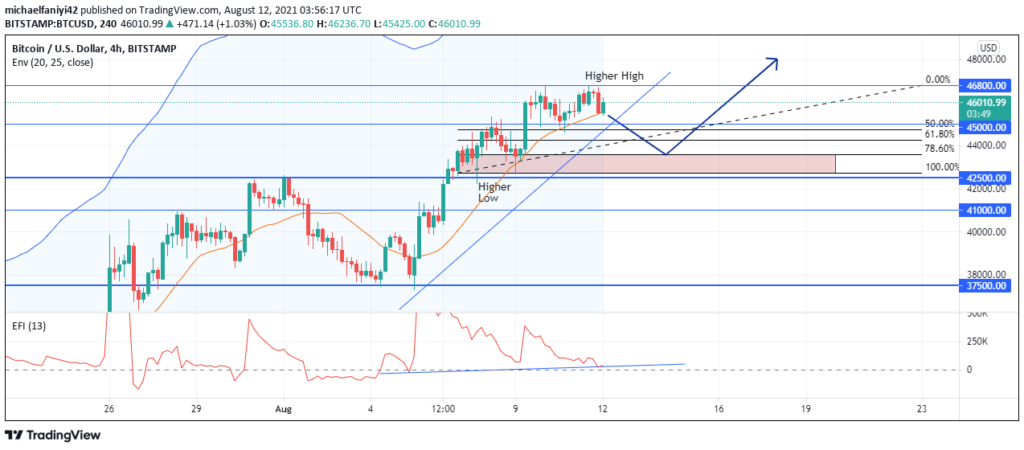
BTCUSD is thus confirmed as bullish. The 4-hour chart could present us with a viable opportunity to join the longs. With prices recently violating the $45,000 level to create a high above, the price could retrace into the most recent 4-hour range delineated in the chart. Plotting the Fibonacci to mark this range, the 78% optimal entry-level is a possible entry point for us, especially as this level coincides with the $44,000 mark and a bullish continuation chart pattern has previously been created at this level also.
As BTC/USD progresses steadily, we could see a breakthrough of $46,800, the current short-term resistance level. The popular crypto coin could also make an aim for the $53,000 zone.
Also read: BTC/USD Bulls Bounce-Off $37.500 Key Level To Go Higher
Note: Crypto-academy.org is not a financial advisor. Do your research before investing your funds in any financial asset or presented product or event. We are not responsible for your investing results.