

BNB Technical Analysis – September 2021
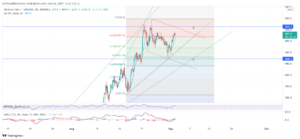
Monthly Analysis
Over the last month, BNB has increased by more than 60%, reaching $518 on August 28. After that, the price retraced to $448 and is now having a correction. Key structures of support and resistance can indicate whether the bullish run of BNB may continue in the following month.
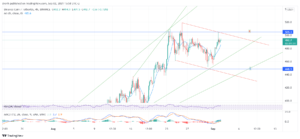

Weekly Analysis
The weekly price movement of BNB has been bearish, following the recent retracement after hitting $518. The price went to as low as $448 and then climbed to $504 recently. The price is now below $500, and BNB can look to retest that level of resistance in order to continue its bullish nature.
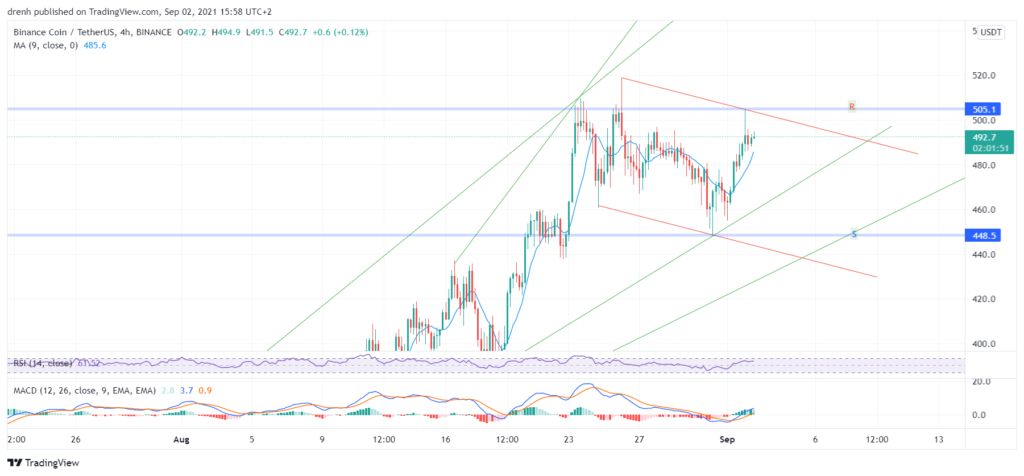
Daily Analysis
As for the daily analysis of BNB, its price has slightly declined by more than 3% and is currently at around $492. In the upcoming hours, the price may keep declining to around $486, but it may eventually retest the resistance at $504
Key Structures
Support
- $448.5
Resistance
- $505
Indicators
Moving Average
The 20-day moving average is below the price and aligns well with previous levels of support. Judging by this, this MA may act as support in the upcoming days. The 9-day moving average was above the price briefly due to the recent retracement, but is now again below and acting as support for the current price of BNB.
Relative Strength Index
The daily Relative Strength Index is at 64. If BNB maintains its bullish nature in the following days, then we might see the RSI go above 70 soon. Then, we might see a correction occur until the RSI is within the 30-70 range. An RSI above 70 does not necessarily suggest a trend reversal, especially for BNB, whose RSI has been at this range for over a month.
MACD
The signal line has just passed the MACD line, indicating that momentum might change and that the price might go down. Nevertheless, the two lines are so close to one another so MACD might increase again and avoid going below its baseline.
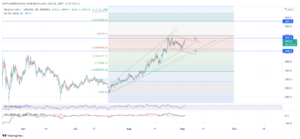
Fibonacci
Over the recent bullish run, if we draw the Fibonacci levels, we can see that the retracement went just below the 50% level. Since the 50% level is not technically a Fibonacci number, then we might see the price retrace at the 61.8% level.

Looking at the price of BNB from the start of the bullish run, we can see that the price is yet to retrace to 38.2%, as it has just broken the support at 23.6%. Since the price has started to increase once again, this indicates that the bullish run might continue for BNB this month as well. The -23.6% Fibonacci level of this bullish run might be a possible target for BNB at $580.

Price Prediction Binance Coin – September 2021
Based on this technical analysis of Binance Coin, if a correction is set to occur, we might see BNB go close to $450, but another increase is very likely to occur. The price this month might increase above $550, and it may even attempt to go close to $600 if the buying pressure is higher at key structures projected in this analysis.
Latest News for Binance Coin – Affecting Price
Understandably, the price of Binance Coin is largely affected by the Binance Exchange. The more trading volume the latter has, the more the price of BNB can surge. In the US, Binance has been facing some regulatory issues. Changpeng Zhao, the founder of Binance, believes that these procedures should not be a problem, and Binance might be as supported in the US as Coinbase. That may undoubtedly increase the demand for BNB tokens.
For more information about the Binance Exchange, check out this article:
Binance Exchange – Definitive Guide to Using the Popular Crypto Exchange