


BAT Technical Analysis – October 2021
Monthly Analysis
In the last 30 days, BAT initially declined by around 20%. However, after finding support at $0.58, BAT started increasing again. It increased by 35% and encountered resistance at $0.78. The price is currently in a correction.

Weekly Analysis
In the last 7 days, BAT has had both bullish and bearish tendencies. Initially, the price increased by 10%, but it then declined by around 10% as well. The price has recently had another price increase of around 8%.
Daily Analysis
In the intraday chart, BAT has been highly volatile. The price has had bearish features in the last few hours as the price has declined by around 4%.
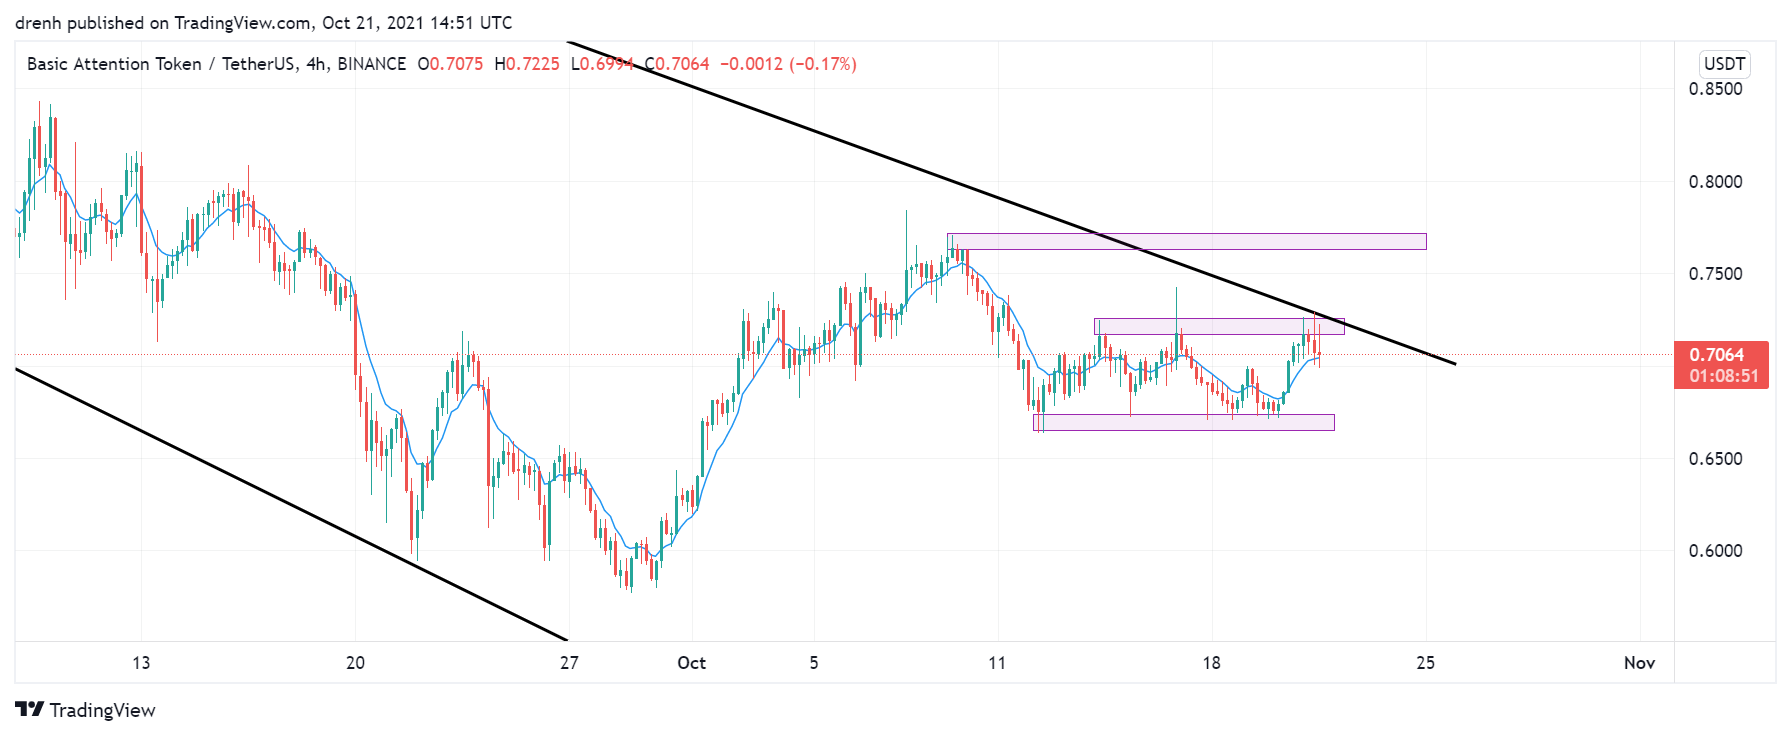
Key Structures
Support
- $0.67
Resistance
- $0.76
Indicators
Moving Average
The 20-day moving average is above the price, indicating that the trend is now downward. This indicates that the price could decrease in the coming days.
The 9-day EMA is below the price due to the recent increase in the last few days. The EMA line can act as support for the price of BAT and might indicate that the price can increase in the shorter run.
Relative Strength Index
The RSI of a daily chart and fairly average at around 50. This provides room for both growth or reduction in the price of BAT. In a 4-hour chart, the RSI is more bullish, and it was recently close to the overbought region.
MACD
The MACD line and the signal line have intersected recently, indicating a shift in momentum. However, the MACD line is attempting to o above once again and retain momentum. In a 4-hour chart, the MACD line is quite above the signal line and above the baseline. This indicates that the price can keep increasing in the short run.
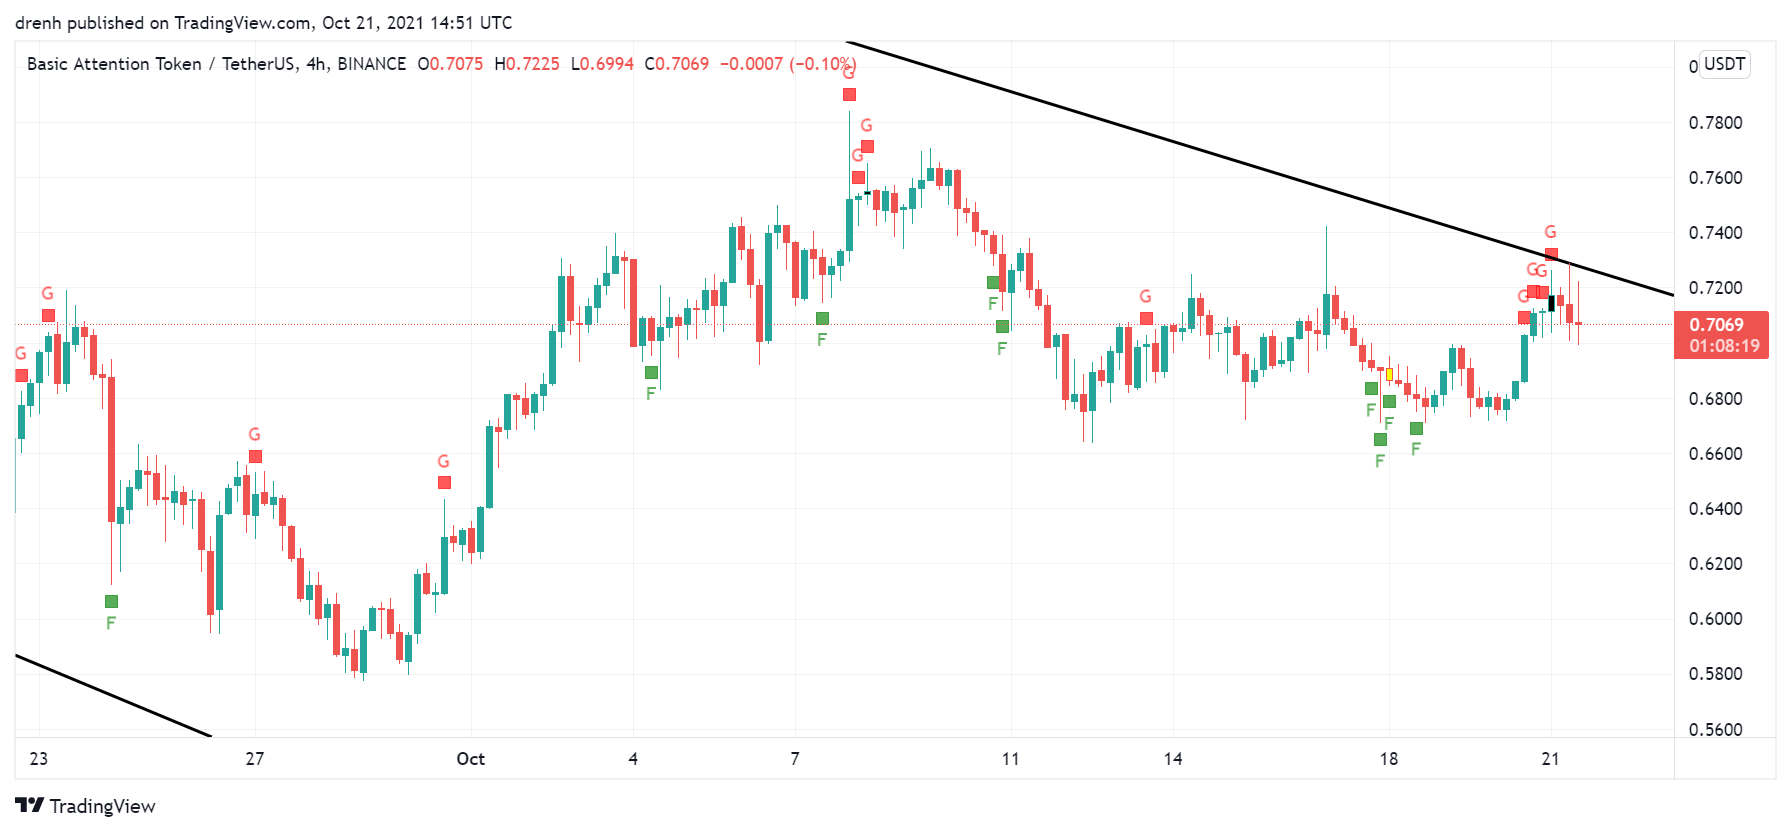
Fear & Greed
The fear and greed indicator of a 4-hour chart suggests that the current emotion of BAT traders is greed due to the recent increase in the price.

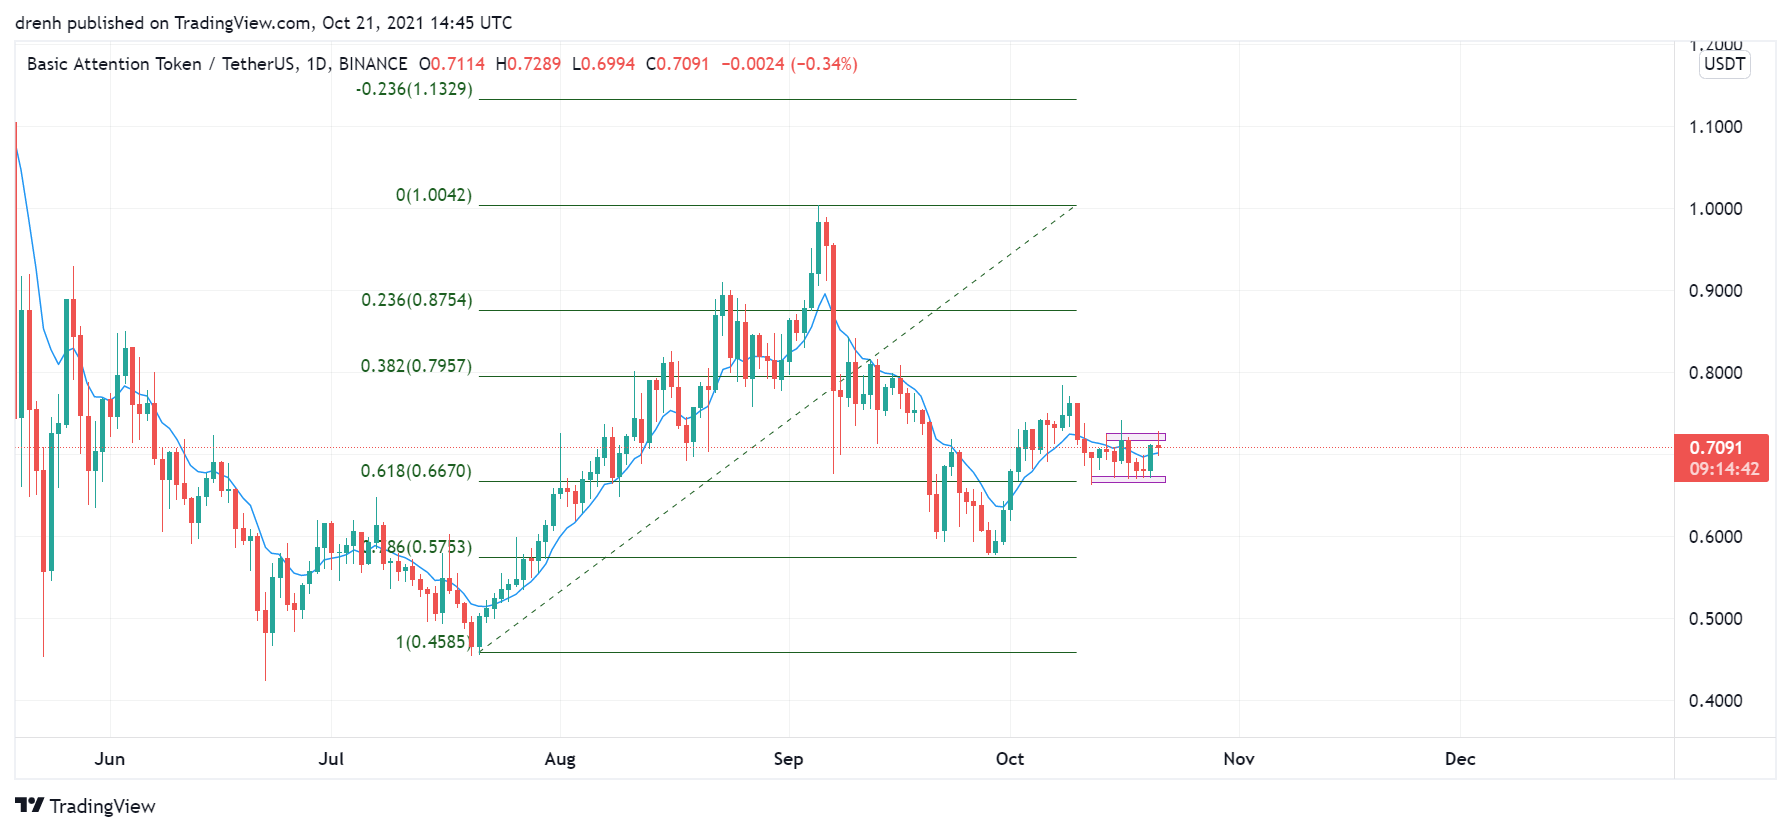
Fibonacci
The Fibonacci retracement levels of the longer-term suggest that the price of BAT has found support at the 78.6% level, and it then started increasing even more. Based on this, BAT could keep increasing in the coming weeks.
Price Prediction BAT – October 2021
Based on this technical analysis on Basic Attention Token (BAT), we could see its price increase up to at least $1 in the coming days if it manages to break the projected resistance structures. Furthermore, if BTC keeps increasing at the same rate, BAT has the potential to go as high as $2 in the coming weeks.
Latest News for BAT – Affecting Price
Recently, Bitcoin (BTC) reached its all-time high. As a bullish trend is about to take over the market, BAT could be affected as well, especially due to its utility. Hence, BAT might reach a new all-time high in this bullish cycle.
Also read: Basic Attention Token Price Prediction 2021, 2022, 2023, 2024, 2025