

BabyDoge Technical Analysis – January 2022
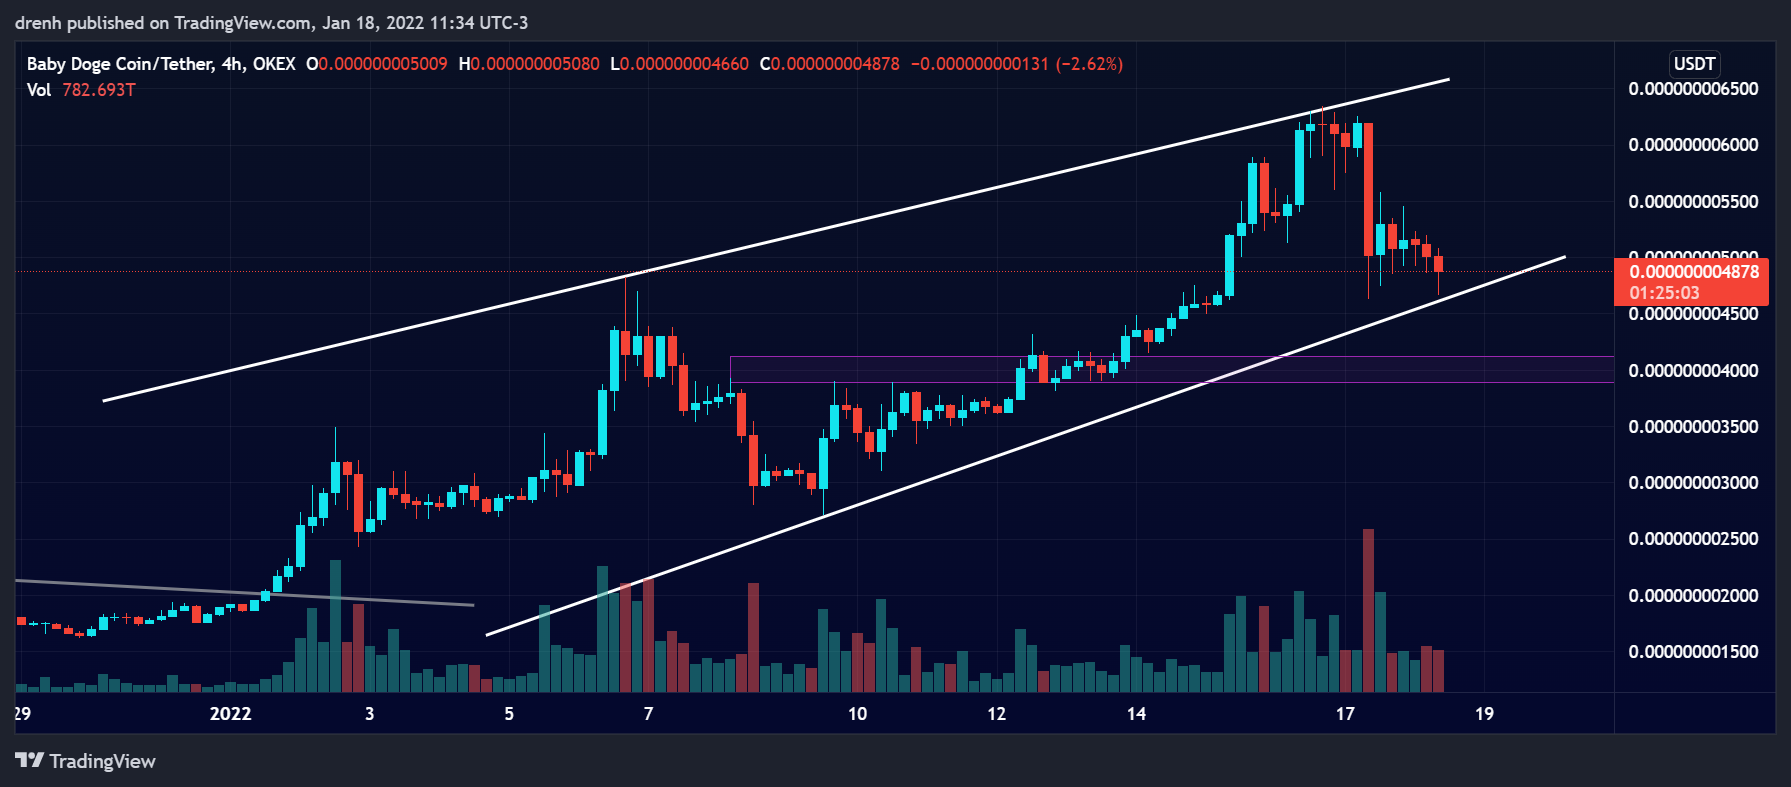
BabyDoge has been quite bullish in the last few weeks. The price has increased by around 350%, making it a huge uptrend for the price of BabyDoge. As the price kept aiming for a new all-time high, it was recently stopped at $0.0000000063, where strong resistance was noticed.
After that, the price had a retracement of around 27%, and it is currently finding support at around $0.0000000046. With that said, the new low is still higher than the previous low point in the uptrend of the 4-hour chart. The trend remains quite bullish for BabyDoge as it aims to continue its journey for a new all-time high in the coming weeks.
The fear and greed index also suggested signs of greed due to the recent price movement, but it was somewhat neutralized from the recent retracement, which could prove to be essential for BabyDoge to continue increasing.

Key Structures
Support
- $0.0000000046
Resistance
- $0.0000000063
Indicators
Moving Average
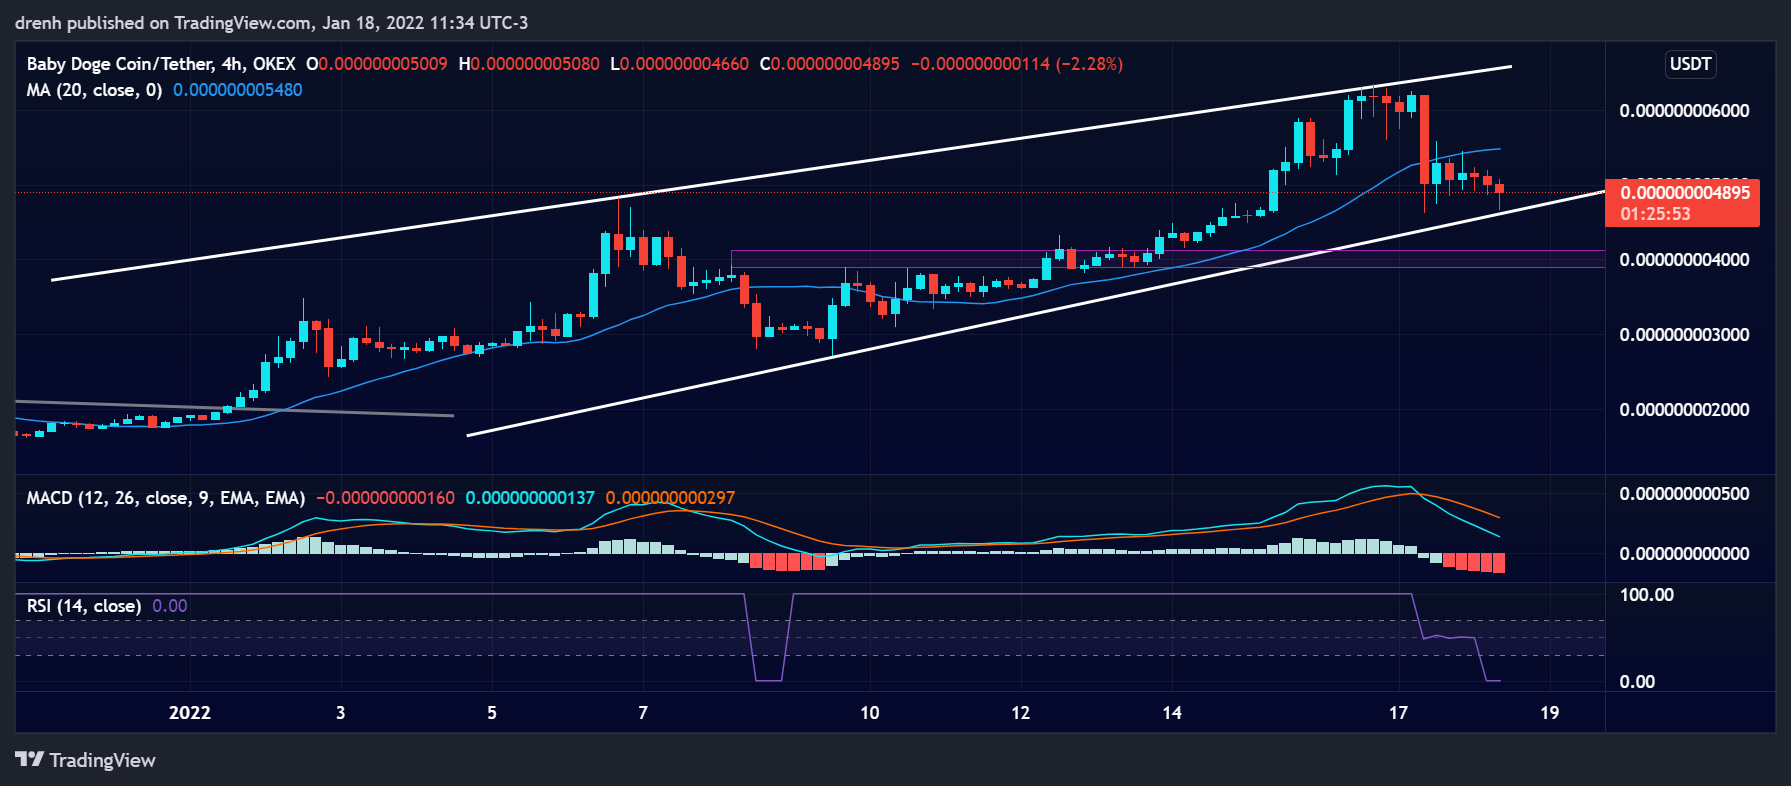
Due to the recent retracement, the 9-EMA of a 4-hour chart moved above the price, indicating a possible reversal. Nonetheless, the price has now moved slightly above it once again, suggesting that the trend may continue for BabyDoge and that the price could keep increasing.
Nonetheless, the 20-MA line has moved above the price, and it currently suggests that the price could decline in the coming weeks.
Relative Strength Index
The RSI of a 4-hour chart is now in the oversold region due to the recent price dip. This suggests that BabyDoge may soon start increasing once again so that the RSI enters the 30-70 region. This also indicates that there is plenty of room for the price of BabyDoge to grow.
MACD
The MACD line of a 4-hour chart is currently below the signal line, but it is still above the baseline. If this continues, then BabyDoge could have a bearish momentum in the coming days.

Fibonacci
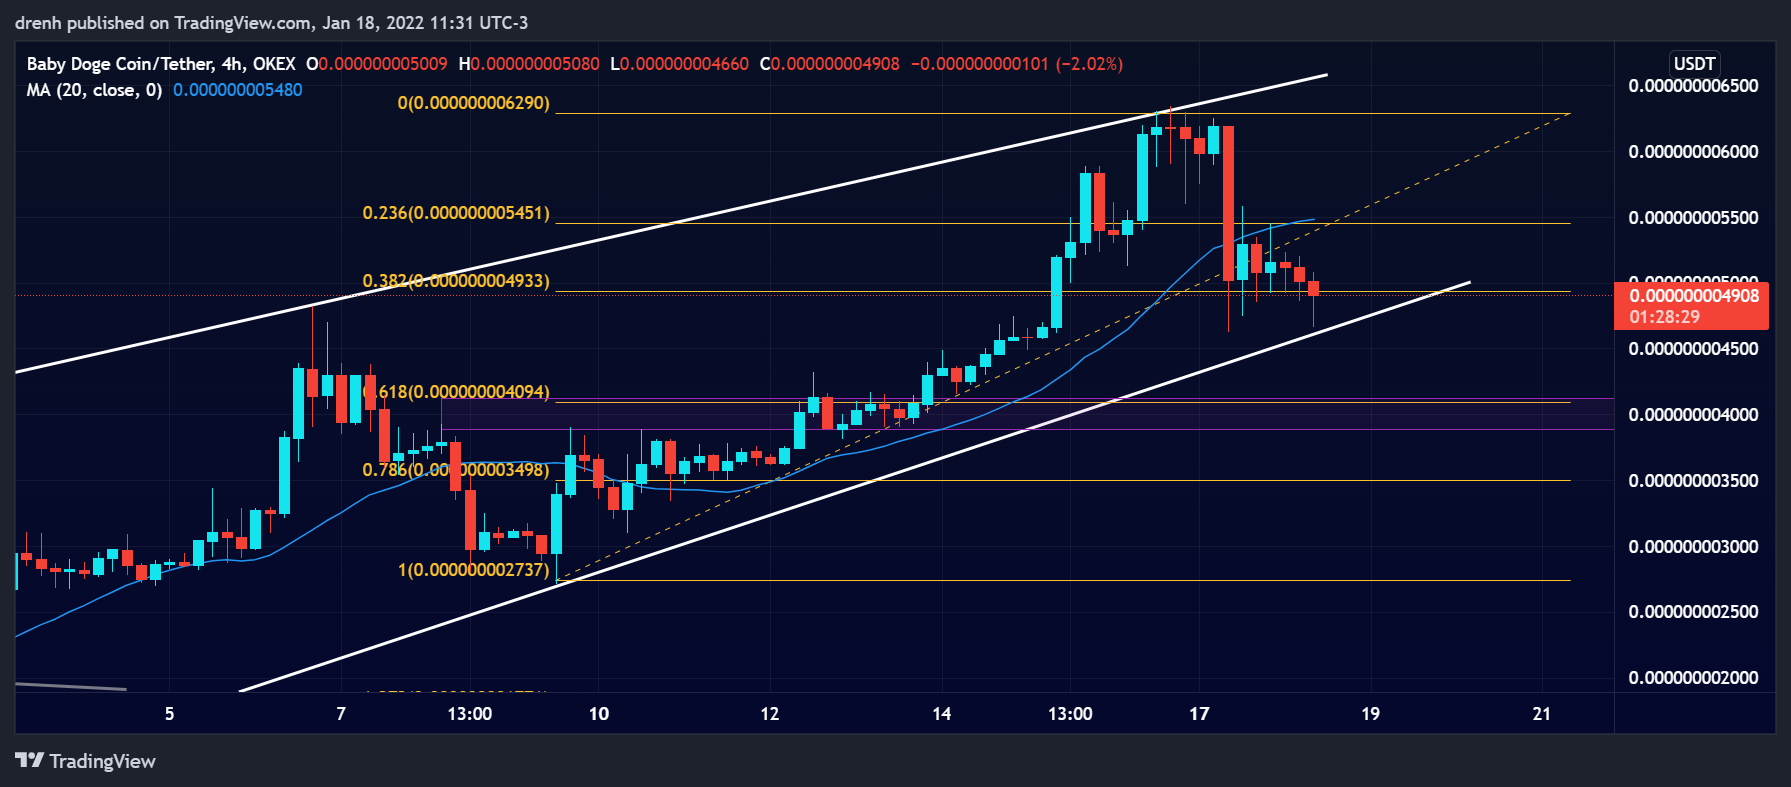
The Fibonacci retracement levels suggest that the price of BabyDoge is currently finding support at around the 38.2% level. Nonetheless, if this structure is broken, then the price could go to the 61.8% level as it also coincides with previous structures.
Price Prediction BabyDoge – January 2022
Based on this technical analysis on Baby Doge Coin (Baby Doge), the price could keep increasing in the coming days if the support is strong at our projected support structures. Other things equal, the price could aim for $0.000000007 and reach a new alltime high soon in the coming weeks, providing that BTC maintains its bullish nature.
Latest News for BabyDoge – Affecting Price
BabyDoge has recently been listed in the CoinEx Global exchange, which could have been one of the factors of its increase in the last few days. This has increased the exposure of the project and could keep playing a role in its price in the coming weeks.
🚀 New Listing
CoinEx Lists #BABYDOGE on 18th Jan@BabyDogeCoin seeks to improve transaction speed & adorableness
✅ Trading Pair: BABYDOGE/USDT
✅ Deposit & Withdrawal: 7AM UTC 18th Jan
✅ Trading: 11AM UTC 18th JanLearn more 👉 https://t.co/q37fIJrD2c#CoinEx #BabyDogeCoin pic.twitter.com/dEw1LZPQxb
— CoinEx Global (@coinexcom) January 18, 2022
Furthermore, BabyDoge has surpassed 1.2 million HODLers in its network. This milestone makes BabyDoge achieve a new record for itself, and it is more than the current number of holders of DOGE or SHIB.
🏆 New Record: #BabyDoge reaches an astonishing 1,225,000+ holders.
Current Holder Count: 1,226,253
💹 The top 1000 BNB wallets are holding 1,011,635,236,121,550 #BabyDoge ($4,668,265 USD)
Source: https://t.co/Uc1nehV7Jr#BabyDoge #BabyDogeCoin #BabyDogeArmy
— WhaleStats – the top 1000 BSC richlist (@WhaleStatsBSC) January 14, 2022
Also read:
Baby Doge Coin Price Prediction 2022 and Beyond- Can BABYDOGE Eventually Hit $1?
Baby Doge Coin Price Prediction 2025 – What Will BabyDoge Price Be In 2025?
Baby Doge Coin Price Prediction 2030 – What Will BabyDoge Price Be In 2030?
BabyDoge Review – Is Baby Doge Coin a Good Investment?