


AXS Technical Analysis – October 2021
Monthly Analysis
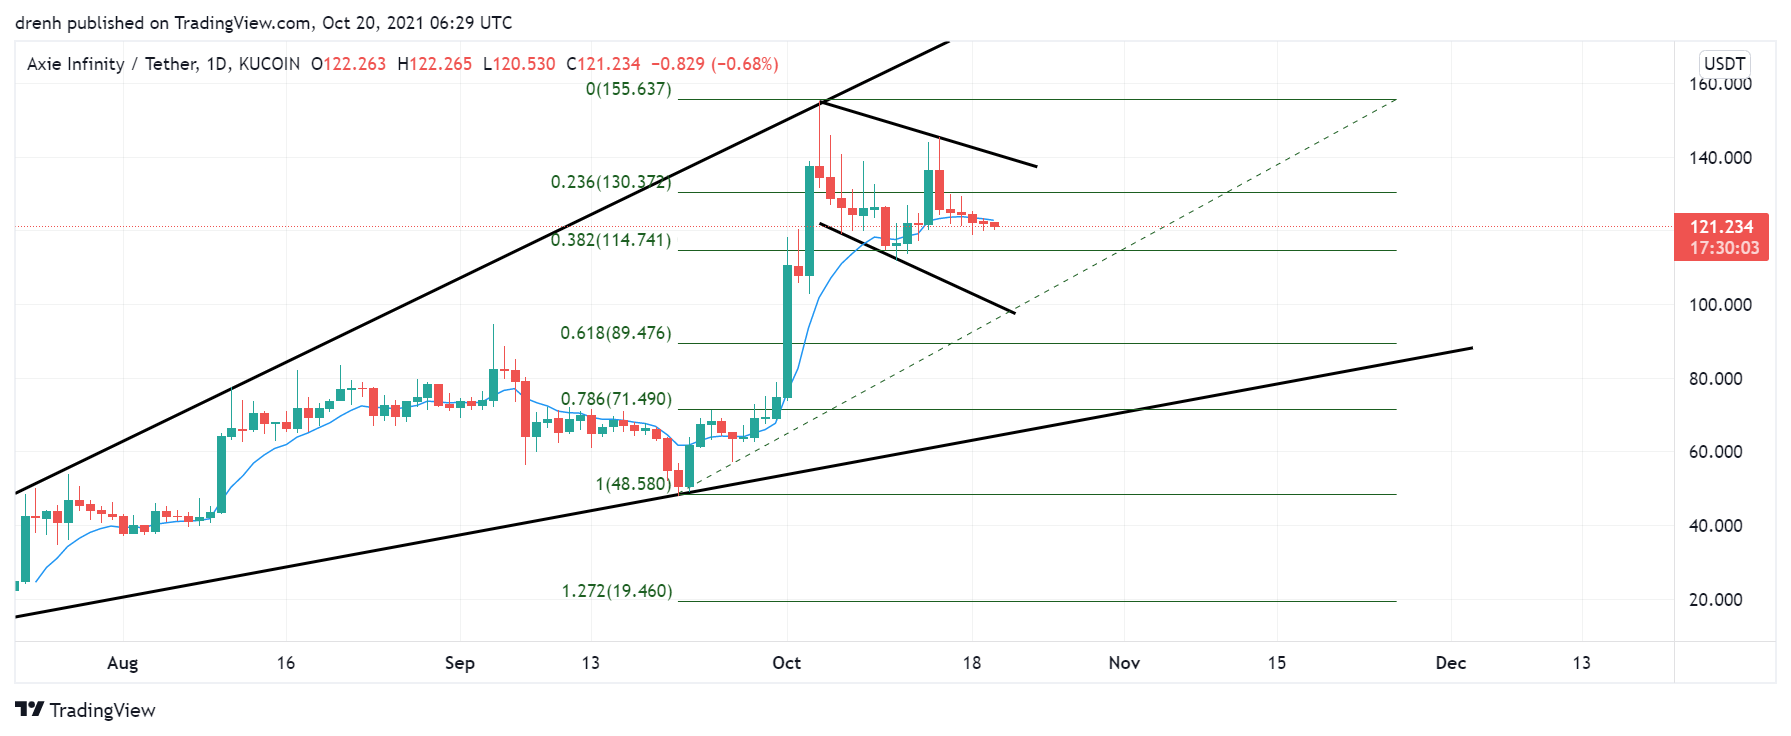
Over the last month, AXS has been extremely bullish. The price has increased by more than 200% in the last 30 days alone, where AXS reached an all-time high at $155. The price has been in correction after that and has decreased by more than 20%.

Weekly Analysis
In the last 7 days, the price of AXS initially increased by 23%. After hitting resistance at $145, AXS then has declined by 18%. The shorter-term trend is bearish, meaning that the price could decrease, but the longer-term trend is bullish.
Daily Analysis
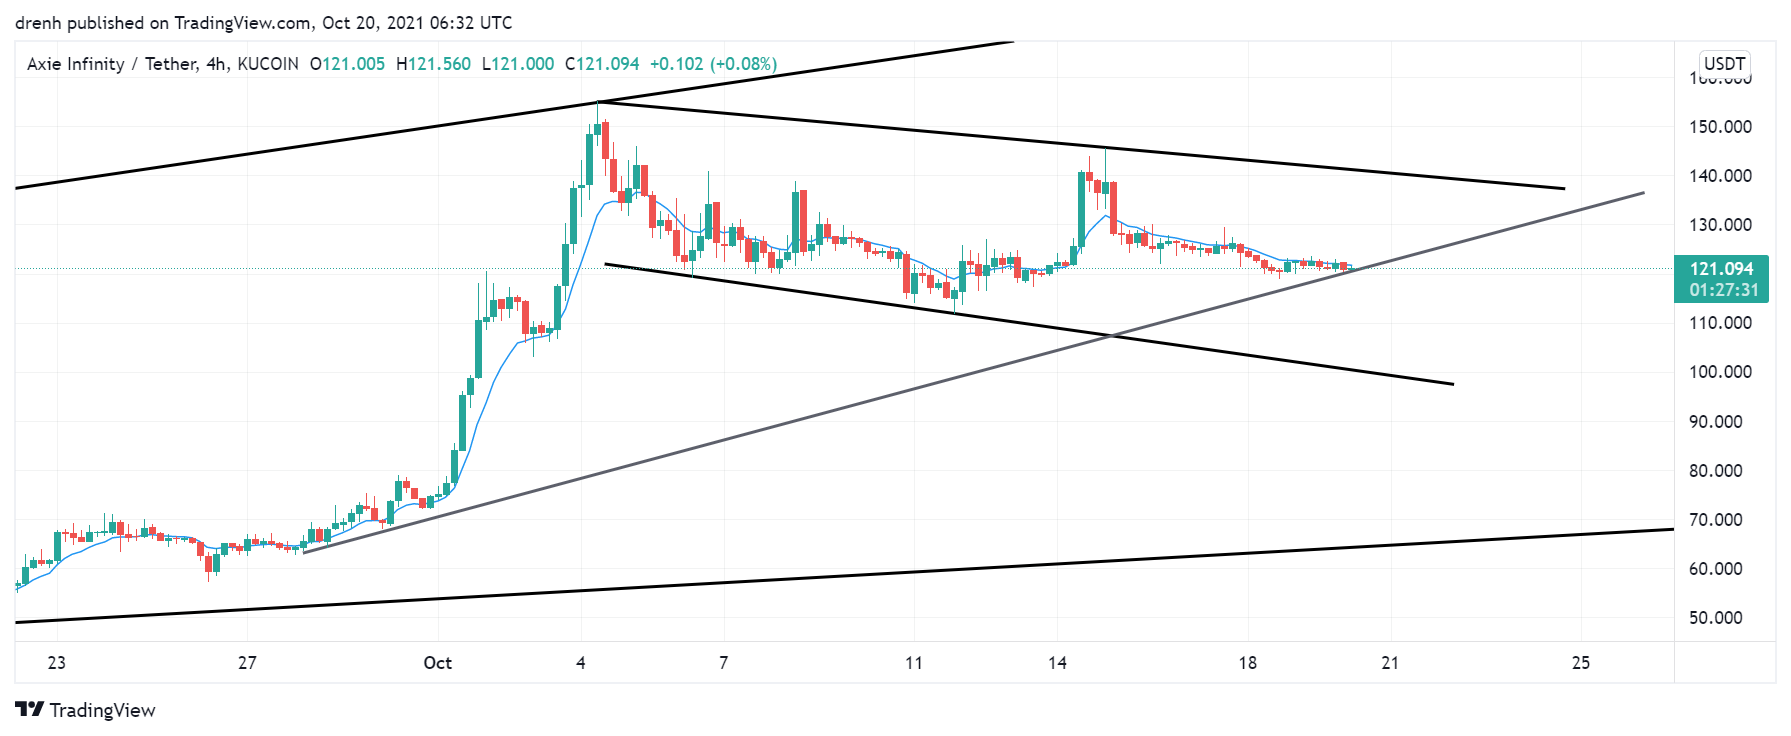
In the intraday chart, AXS has been in consolidation. The recent price movement has formed a descending triangle pattern, indicating that a bearish breakout could occur in the coming hours for AXS.
Key Structures
Support
- $113
Resistance
- $155
Indicators
Moving Average
The 20-day moving average had been below the price due to the enormous increase of AXS. Nonetheless, it has moved slightly above the price because of the recent price correction, indicating that the price may now decline.
The 9-day EMA is also slightly above the price and currently acting as resistance for the price of AXS. This suggests that AXS could decrease in the short run if the price fails to beat resistance at the EMA line.
Relative Strength Index
The RSI has slightly declined lately, and it was expected since AXS was in the overbought region. Nonetheless, the RSI is still bullish. In a 4-hour chart, the RSI is more bearish and approaching the oversold region.
MACD
The MACD line has recently moved below the signal line and is now heading below the baseline. This indicates that the momentum is now bearish in a 1-day chart. In a 4-hour chart, the MACD line has been below the signal line and below the baseline. However, the lines are converging, and if they intersect, the momentum might become bullish for AXS.
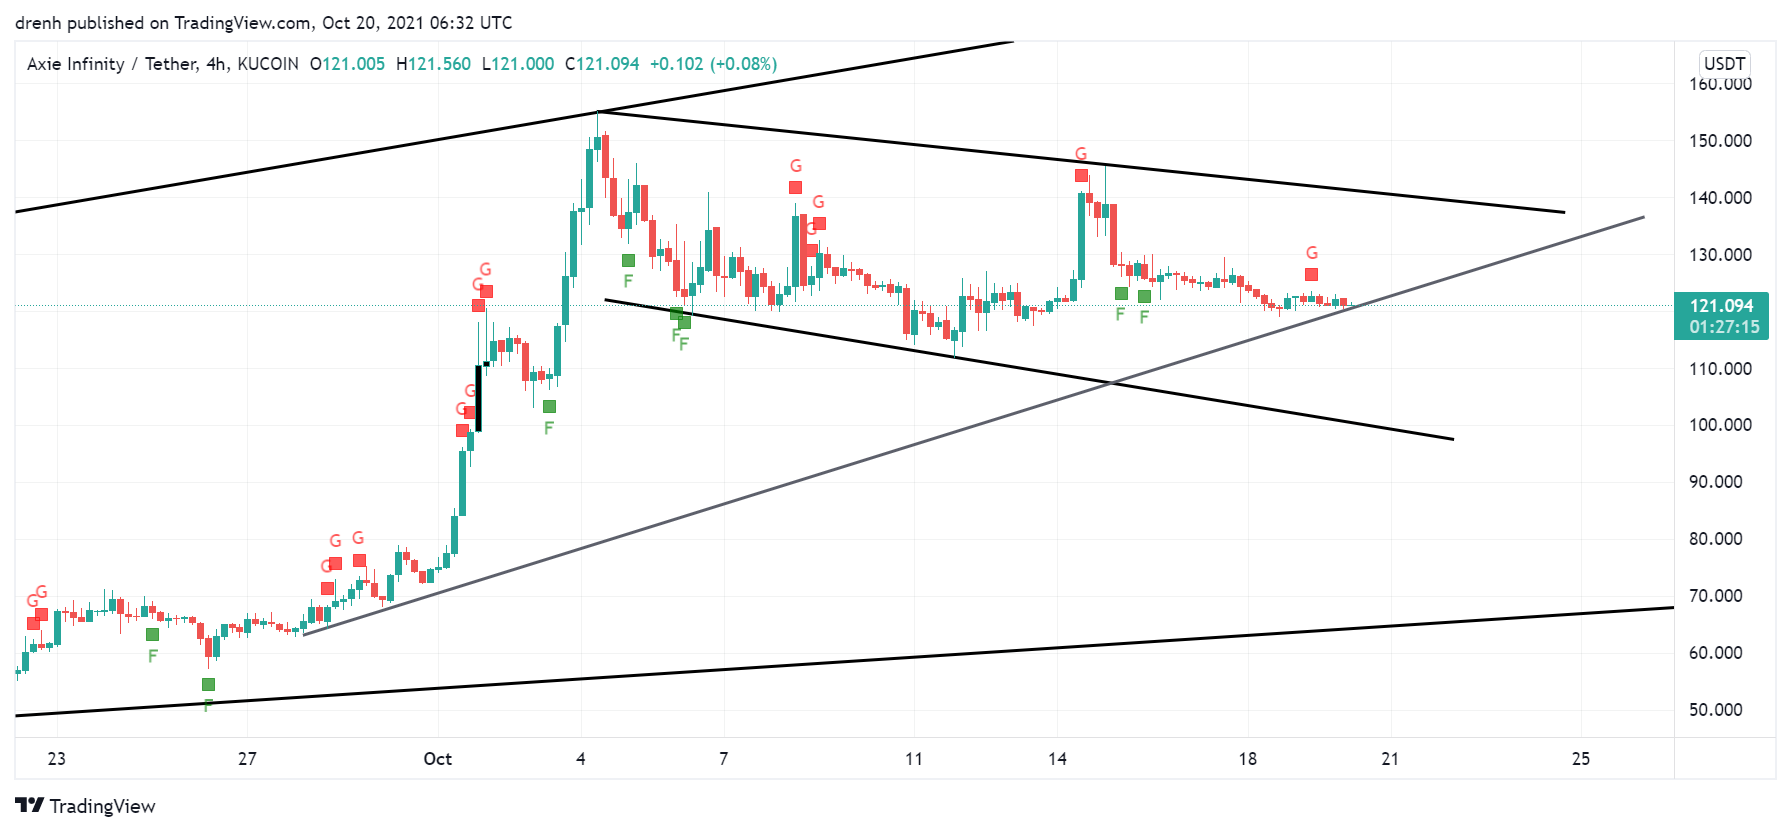
Fear & Greed
Even though the price has declined recently, the fear and greed indicator of a 4-hour chart suggests that the current emotion of AXS traders is fear.

Fibonacci
The Fibonacci retracement level of a 1-day chart suggests that the price has recently found support at the 38.2% level. This might indicate that the price could surge upwards in the coming weeks.
Price Prediction AXS – October 2021
Based on this technical analysis on Axie Infinity (AXS), we might see its price decline in the short run and retest support at $113. However, the longer-term trend is still bullish, forming a broadening wedge. AXS could soon reach a new all-time high. Furthermore, if BTC keeps increasing at the same rate, a price of $200 is possible for AXS.
Latest News for AXS – Affecting Price
NFTs have become one of the most important assets of 2021. With Axie Infinity’s main focus being on NFTs and gaming, the demand for AXS has increased massively. This is likely to continue throughout this quarter, hence, the price of AXS could keep going upwards.
Also read: Axie Infinity (AXS) Price Prediction 2021 and Beyond – Will AXS Hit $200 in 2021?