

AXS Technical Analysis – November 2021
Monthly Analysis
Axie Infinity had quite a successful run in the last 30 days. The price increased by 43%, where AXS hit a new all-time high at $165. AXS attempted to break resistance at the all-time high on several occasions, but the selling pressure was high. The price of AXS has started declining again, where a decrease of 26% has occurred so far.

Weekly Analysis
In the last 7 days, AXS has been bearish. The price has declined by 18%, indicating that the trend might have reversed and that the price of AXS could further decline in the coming days of this month. Nonetheless, AXS is still bullish in the longer run.
Daily Analysis
In the intraday chart, AXS initially increased by around 4%. However, the price then went down by 7%, indicating that AXS is bearish even in a shorter time frame. The coming hours are crucial to see whether the projected support structure may prevent the downtrend from continuing.
Key Structures
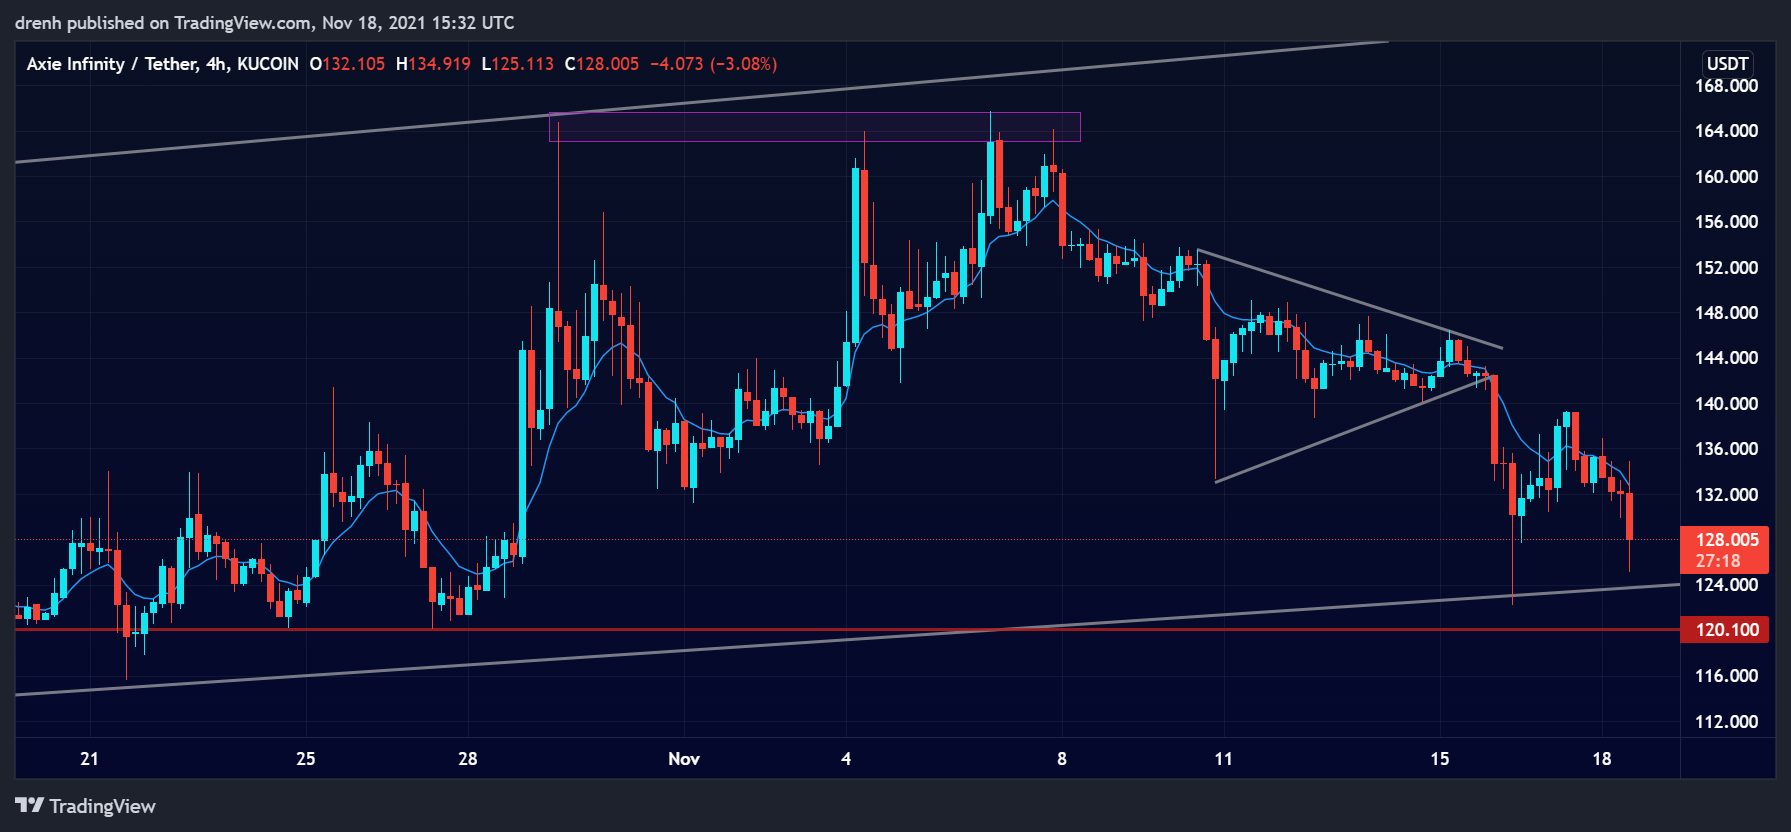
Support
- $121
Resistance
- $139
Indicators
Moving Average
The 20-moving average of a 4-hour chart is above the price due to the recent downtrend. This indicates that the price of AXS may keep declining in the coming days.
The 9-EMA of a 4-hour chart is also currently above the price, hinting at a continuation of the high selling pressure. The EMA line could act as a resistance structure if the price of AXS attempts to increase.
Relative Strength Index
The RSI of a 4-hour chart is close to 30. If the price further declines, then we could see an impulse upward as AXS becomes oversold. Nonetheless, it suggests that traders are bearish.
MACD
The MACD line of a 4-hour chart has recently intersected with the signal line and is now moving below the baseline. This indicates that the momentum is bearish for Axie Infinity and that traders could move its price further down.
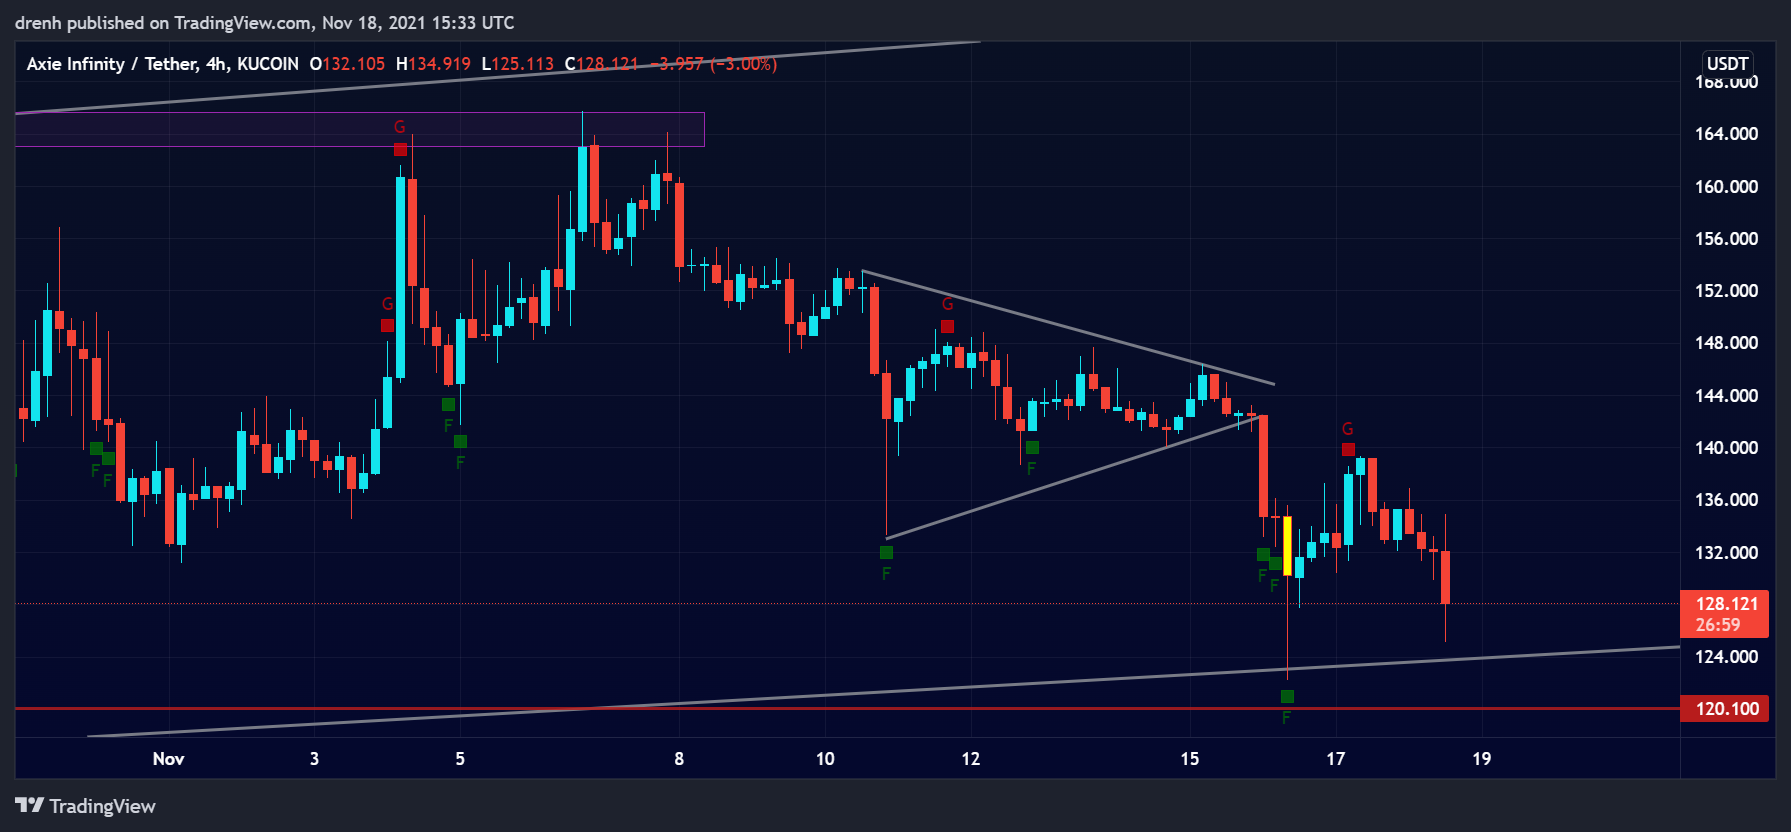
Fear & Greed
The fear and greed indicator of a 4-hour chart displayed signs of greed in the recent impulse wave. However, this is about to turn into fear as the price is now having another surge downwards.
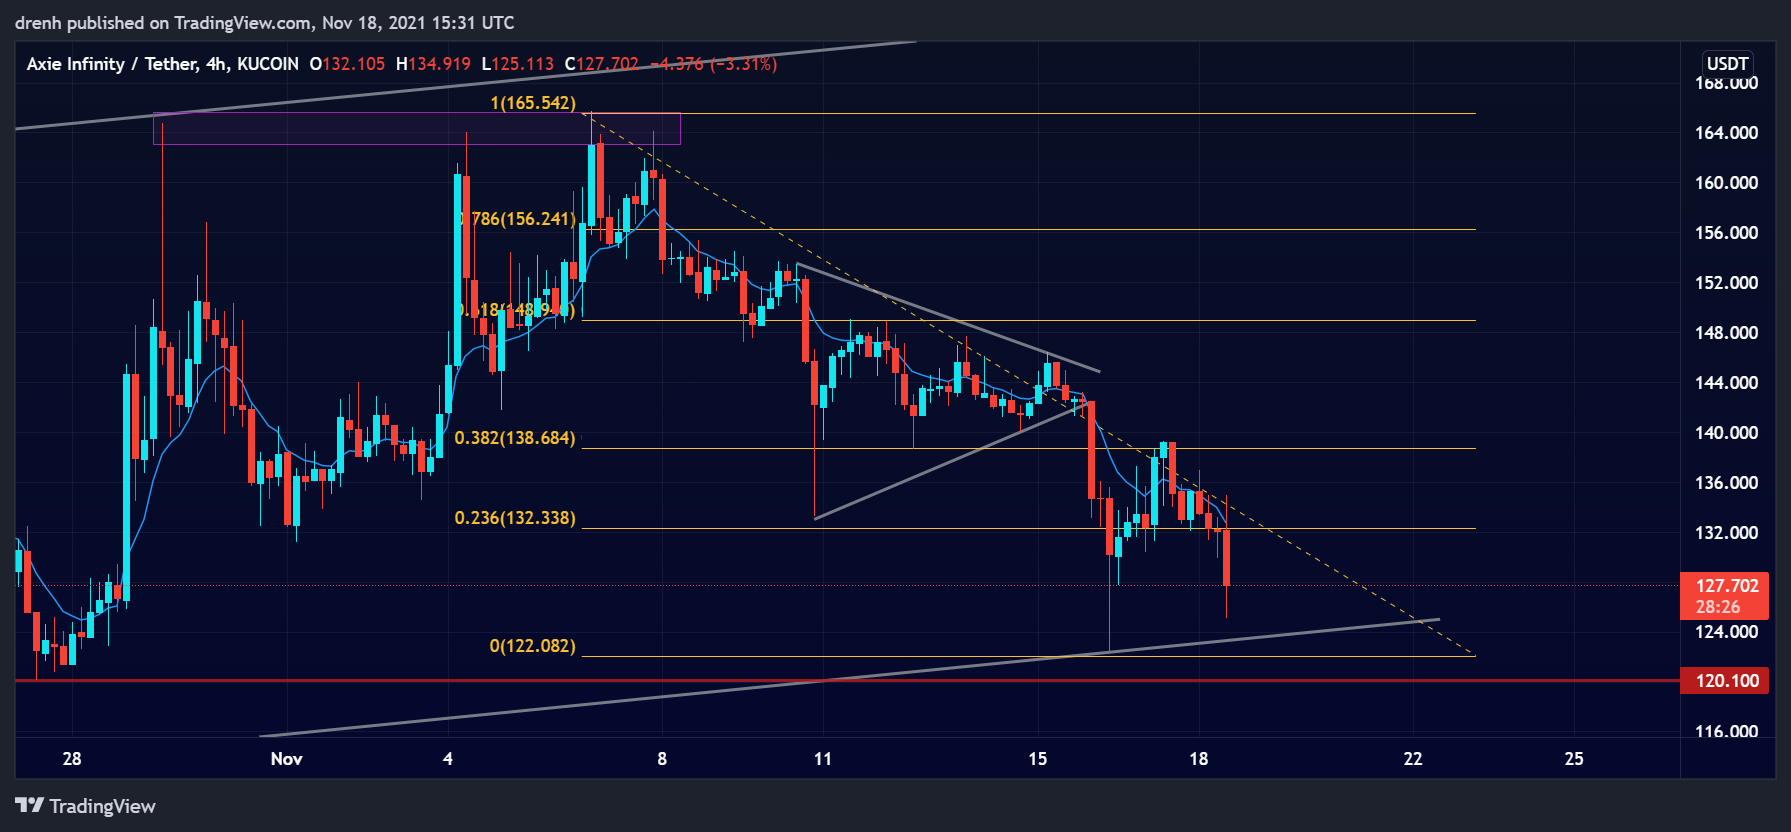
Fibonacci
The Fibonacci retracement levels of a 4-hour chart suggest that the price of AXS has recently encountered resistance at the 38.2% level. This could see the price of AXS keep declining in the coming days.
Price Prediction AXS – November 2021
Based on this technical analysis on Axie Infinity, we might see its price decline as low as $112 in the coming days, other things equal. If the buying pressure is low at that point and the price of AXS keeps declining, then the price could go below $100 and close to $95. If the bull run in the market continues, and BTC aims for $100,000, we could see AXS rebound upward and even reach a new all-time high. Considering the utility that the AXS token has for the gaming industry, that price is attainable by the end of the year.
Latest News for AXS – Affecting Price
While the play-to-earn games on Axie Infinity have shown success and allowed users to generate enormous profits by playing games, that has not been the case recently. Players are currently earning less than the minimum wage in Phillippines. This could lower the demand for AXS tokens as users become less encouraged for play-to-earn games.
Also read: Axie Infinity (AXS) Price Prediction 2021 and Beyond – Will AXS Hit $200 in 2021?