

AXS Technical Analysis – December 2021
Monthly Analysis
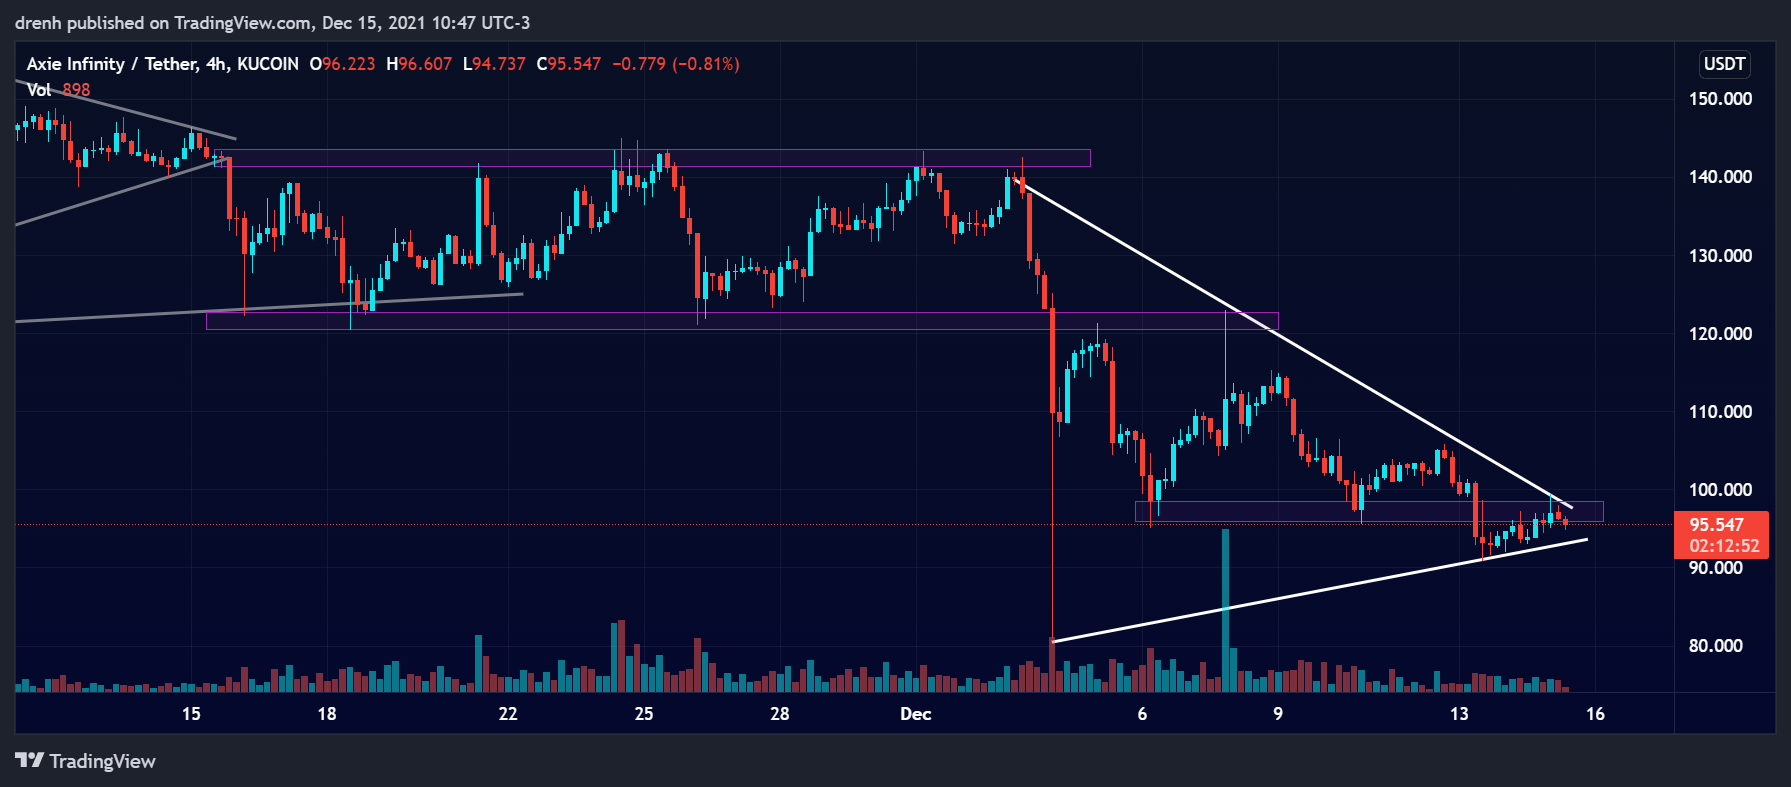
In the last 30 days, AXS has been quite volatile. The price fluctuated initially by 15% to 18% continuously, but it then formed a double top at $145. This led to a bearish breakout of 43%, suggesting that AXS is now in a downtrend. The price has been attempting a correction after that, but resistance at $122 led to another decline in the price. Despite forming a double-bottom at $96, the price has kept going down and it is currently facing resistance right at that area around $96. A triangle pattern has been created from the recent price movement in the 4-hour chart, indicating that a breakout could occur soon.

Weekly Analysis
In the last 7 days, the price of AXS has been declining. It has dropped by around 25% so far, and it may continue doing so if it fails to break resistance at our projected structures. Furthermore, the price could have a bearish breakout soon, meaning that sellers have taken over once again.
Daily Analysis
In the intraday chart, the price was initially bullish since it increased by around 5%. Nonetheless, it had another decline of around 5% in the following hours, suggesting that AXS is bearish in the shorter run as well.
Key Structures
Support
- $91
Resistance
- $98
Indicators
Moving Average
The 20-moving average of a 4-hour chart is currently above the price of AXS, indicating that Axie Infinity is currently in a downtrend and that the price could keep declining in the coming days.
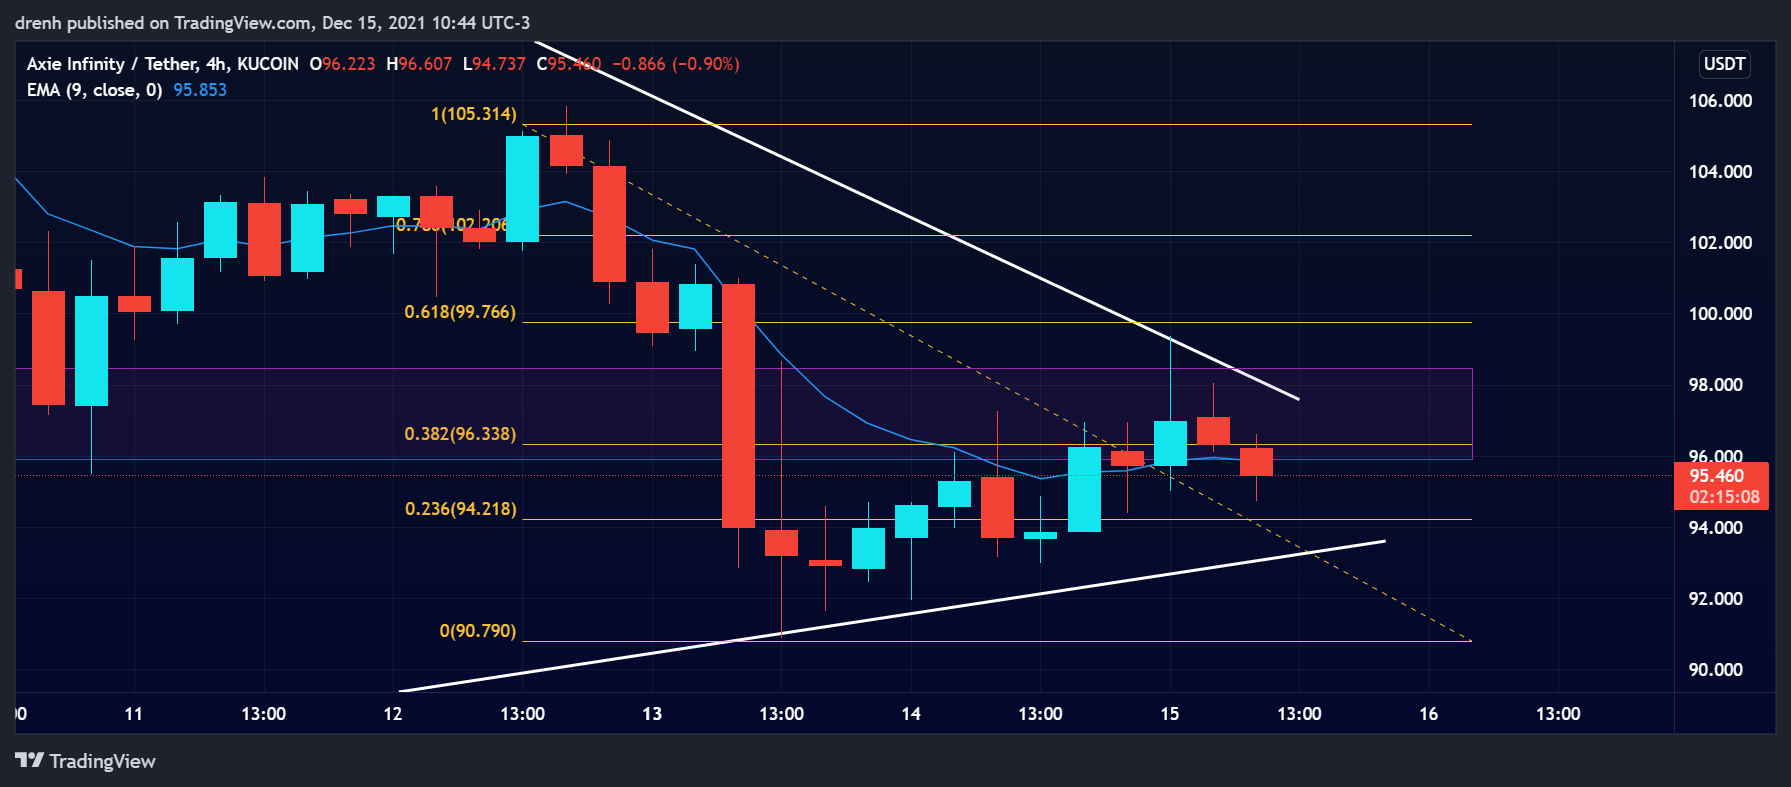
The 9-EMA is also slightly above the price due to the recent dip in the last couple of candlesticks. This indicates that the AXS remains bearish in the short run and that the EMA line could act as a structure of resistance if the price attempts to increase.
Relative Strength Index
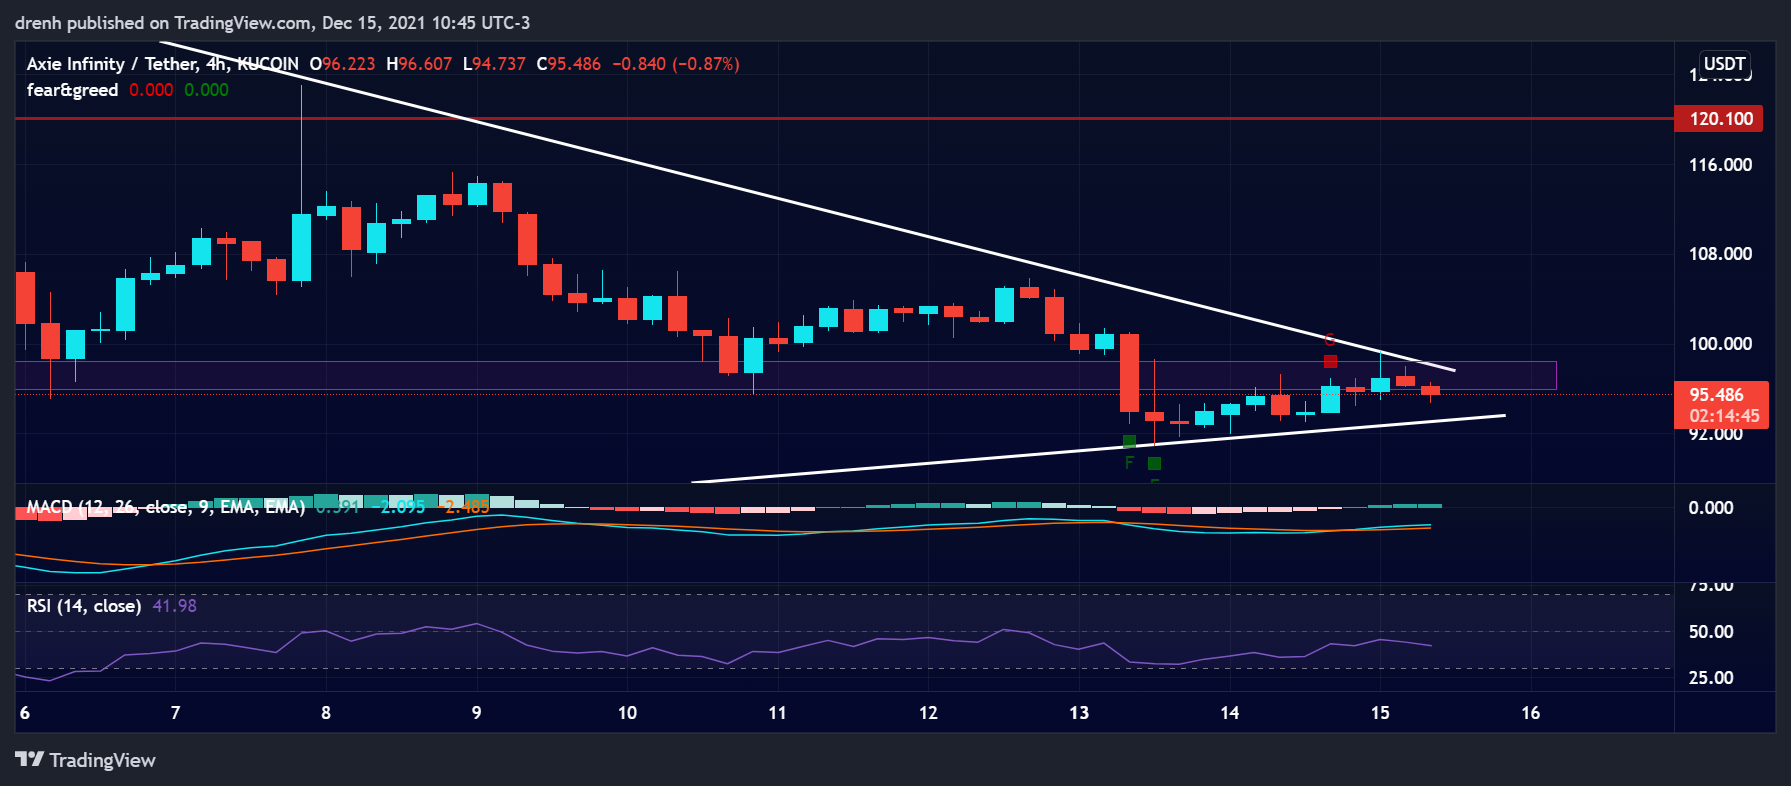
The RSI of a 4-hour chart is within the 30-70 range, suggesting that there is plenty of room for the price to either grow or decline. Nonetheless, it is still slightly below 50, meaning that there is more selling pressure rather than buying at the current price of AXS.
MACD
The MACD line of a 4-hour chart is currently above the signal line but below the baseline. This indicates that the current momentum is building up to be bullish in the short run, meaning that AXS could potentially increase in the coming days.
Fear & Greed
The fear and greed indicator of a 4-hour chart suggests that the current emotion of AXS traders is still greed, despite the fact that AXS is currently in a downtrend.

Fibonacci
The Fibonacci retracement levels of a 4-hour chart suggest that the price had recently retraced close to the 61.8% level, meaning that it could head further down in the coming days if support is not strong.
Price Prediction AXS – December 2021
Based on this technical analysis on Axie Infinity (AXS), we could see its price find support at $91. However, if the selling pressure remains high, AXS could as well go below $87 in the coming days. Nonetheless, indicators suggest that there is room for growth for AXS. If the market takes another bull turn in the coming weeks, AXS could potentially reach $140 once again by the end of this month.
Latest News for AXS – Affecting Price
Recently, metaverse-related cryptocurrencies have been gaining a lot of hype, considering the fact that the metaverse can change the internet once and for all. Axie Infinity could benefit from this as well since it is a metaverse-related project.
Also read:
Axie Infinity (AXS) Price Prediction 2021 and Beyond – Will AXS Hit $200 in 2021?
These Are The Top 9 Cryptocurrencies That Could Explode In 2022
Cryptocurrency and Metaverse – What is the Connection Between Cryptocurrencies and Metaverse?
These are the Top 5 Metaverse Coins to Buy Right Now
Best Cryptocurrencies to Buy Right Now – 4 Trending Cryptocurrencies to Watch