


AVAX Technical Analysis – October 2021
Monthly Analysis
Over the last 30 days, AVAX has been bearish. This price decline came forth after AVAX reached an all-time high at $79. The price has declined by around 36% after that. The trend is downward for AVAX.

Weekly Analysis
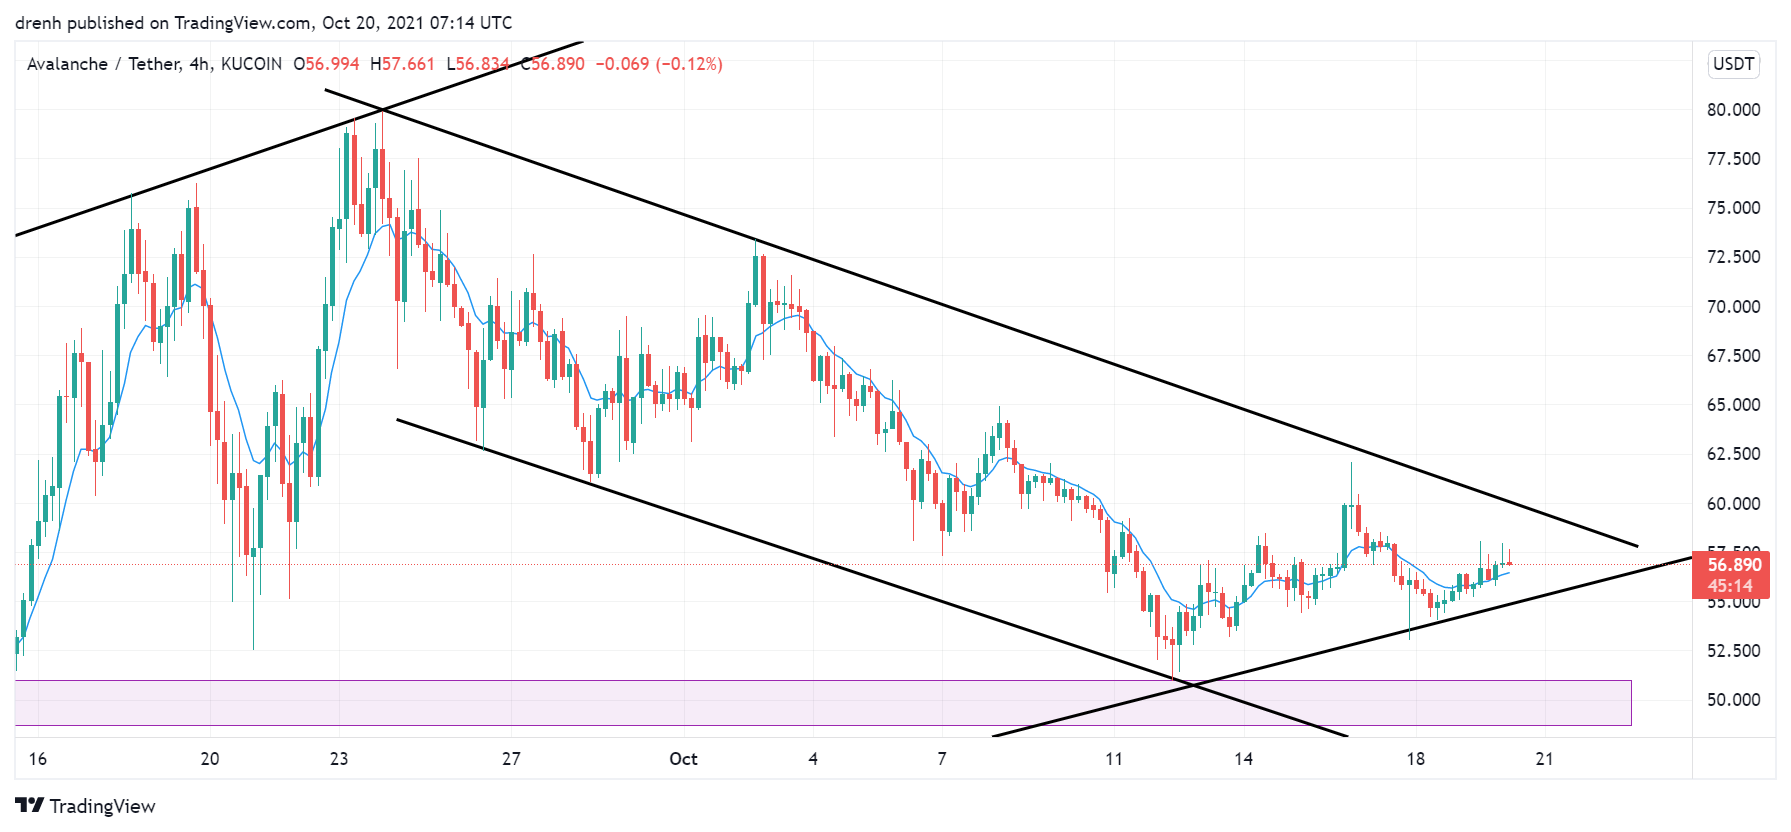
In the last 7 days, AVAX had increased by around 16%, indicating that the trend was reversing. However, the price decreased again after that by 14%. AVAX is currently attempting to retest the previous high at $60.
Daily Analysis
In the intraday chart, AVAX has been highly volatile. While its price increased in the early hours of the day, it declined again at the same point, leaving plenty of profitable trades for day traders.
Key Structures
Support
- $51
Resistance
- $65
Indicators
Moving Average
The 20-day moving average is quite above the price of AVAX due to the recent downtrend. Unless there is a bullish breakout, the MA line indicates that the price of AVAX could keep decreasing in the coming days.
The 9-day EMA is currently acting as resistance to the price of AVAX. If today’s candlestick in a 1-day chart closes above the EMA line, then we could see the trend reverse and the price of AVAX increase in the short run.
Relative Strength Index
The RSI of a daily chart has been fairly average and below 50. This indicates that the momentum is slightly bearish, but it also means that there is room for growth for AVAX. In a 4-hour chart, the RSI is slightly more optimistic.
MACD
The MACD line has been below the signal line for quite some time in the daily chart, indicating that the trend is bearish for AVAX. Nonetheless, the lines are slowly converging, hinting at a possible shift in momentum soon. In a 4-hour chart, the momentum has become bullish after MACD recently moved above the signal line and above the baseline.
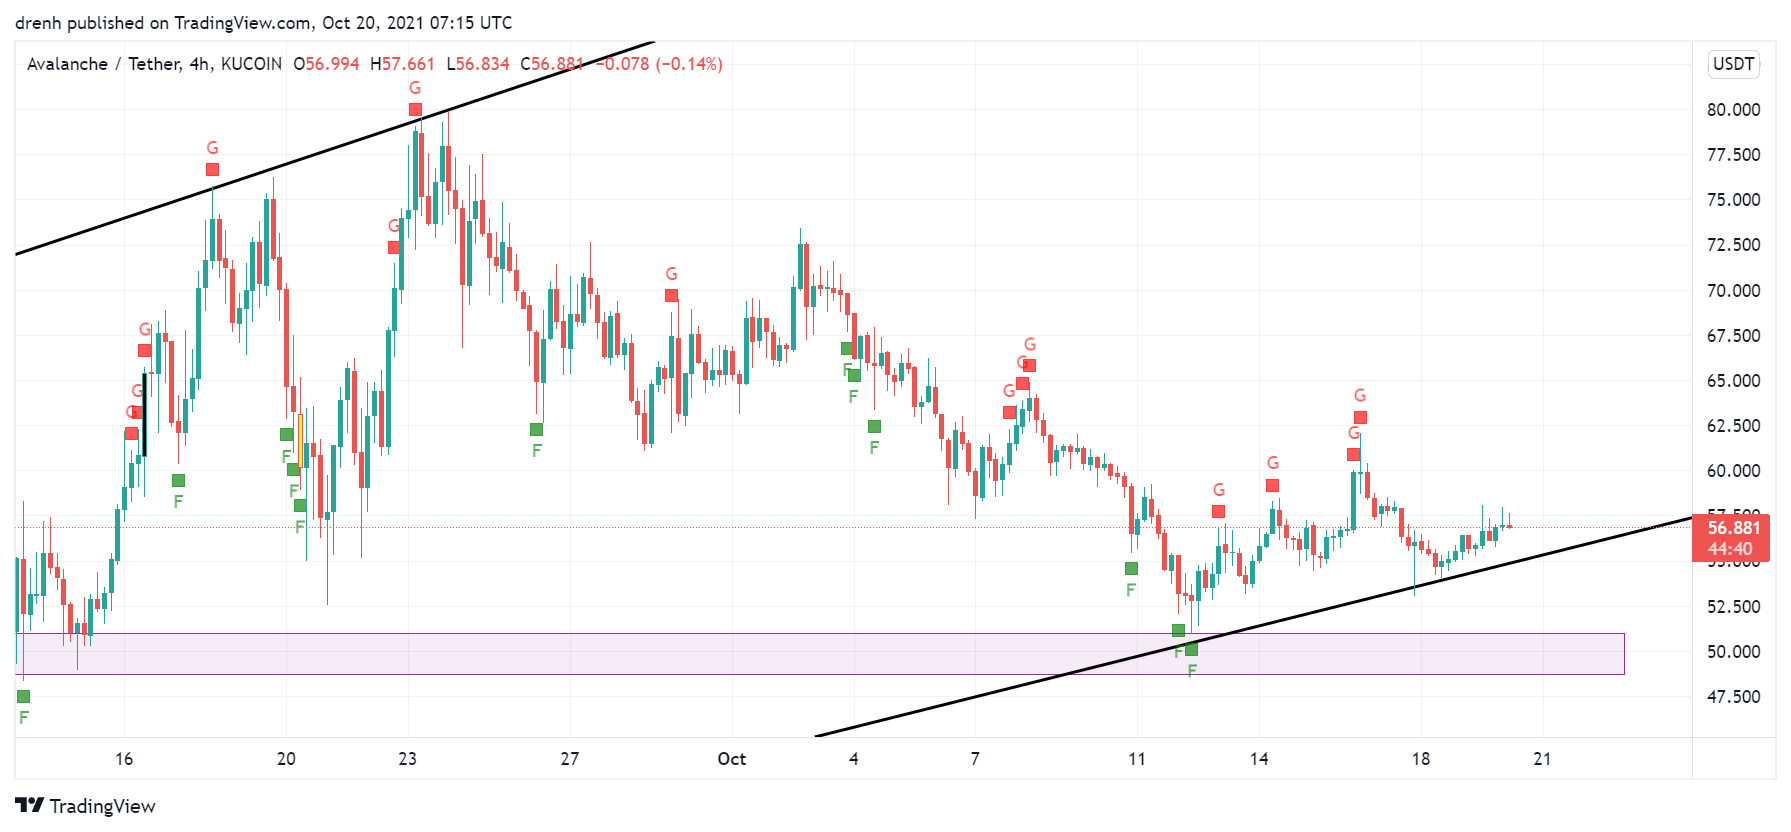
Fear & Greed
The fear and greed indicator in a 4-hour chart suggests that the current emotion of AVAX traders is green, meaning that traders are bullish.
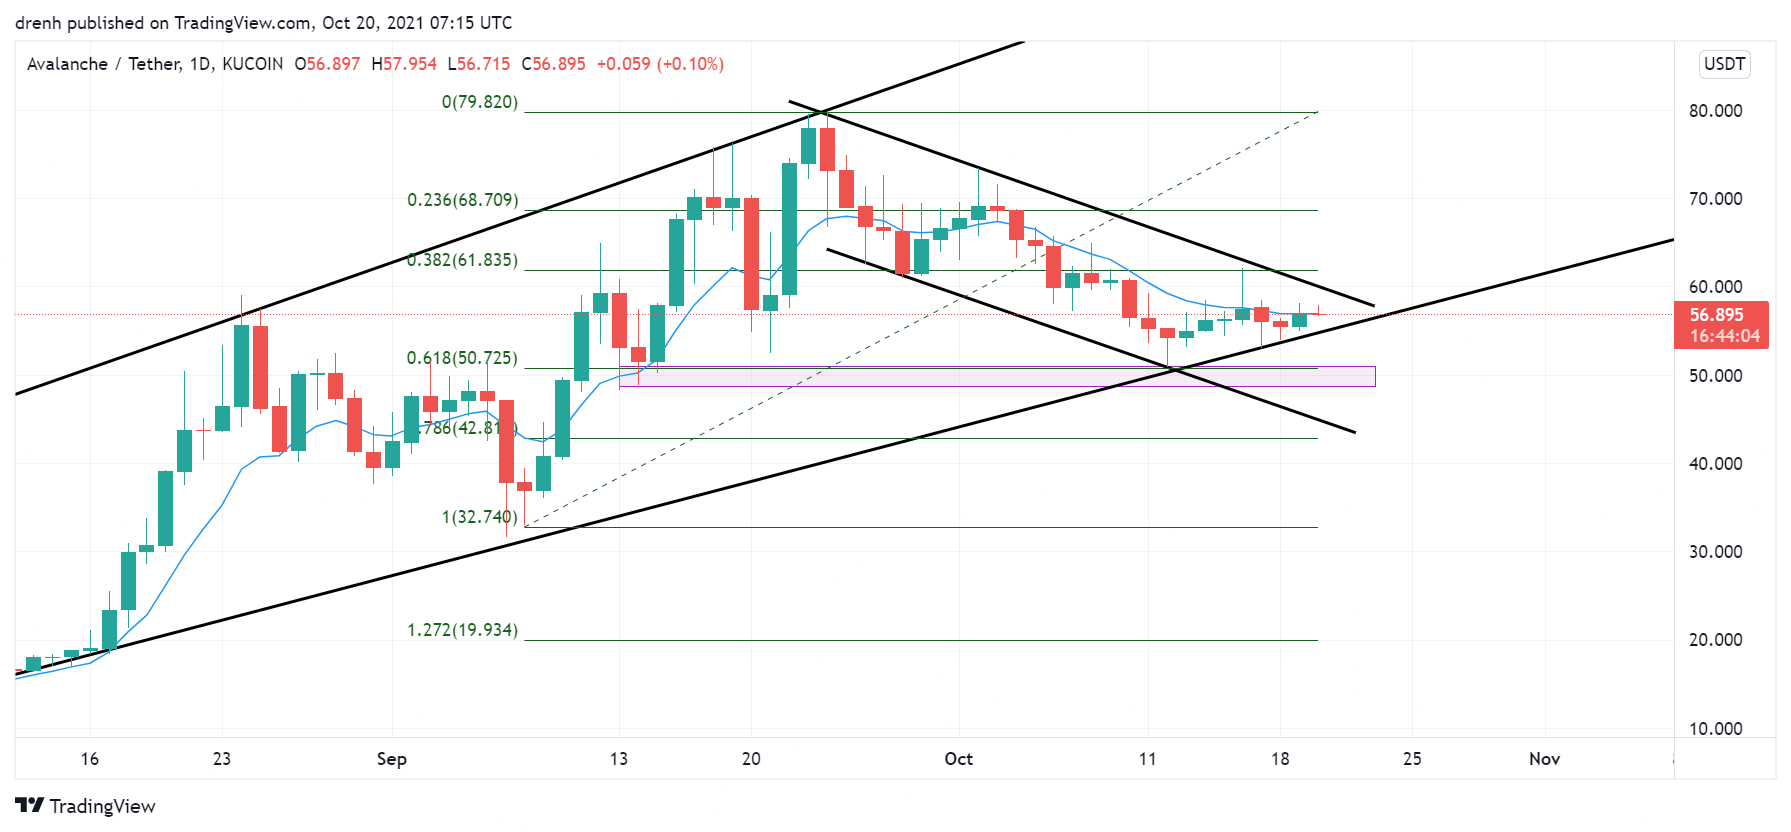
Fibonacci
The Fibonacci retracement level in a 1-day chart forecasts that the price of AVAX has recently found support at the 61.8% level. Other things equal, AVAX could aim for the 23.6% extension level in the coming weeks.
Price Prediction AVAX – October 2021
Based on this technical analysis on Avalanche (AVAX), we could see its trend reverse after finding support at the 61.8% level. Furthermore, the longer-term trend of AVAX is bullish, indicating that the price could increase in the long run. With BTC continuing its bullish run, we could see AVAX reach a new all-time high and go close to $100 in the coming weeks.
Latest News for AVAX – Affecting Price
Avalanche Foundation has announced that they will be allocating $3 million as incentives for Stake DAO strategies. This could have a positive effect on the price of AVAX in the coming weeks.
Also read: Avalanche (AVAX) Price Prediction 2021 and Beyond – Will It Grow Even More?