

Avalanche placed itself very well in the cryptocurrency sphere as one of the fastest blockchains. Our Avalanche price analysis reveals a bullish cup and handle formation that is likely to keep the price up by a good margin in the days to come.
The year-to-date (YTD) high for AVAX was recorded on the 2nd of January when the proof of stake cryptocurrency hit the $116.6 mark and the rest of the month was mostly within the market trend. The next high came in April when the coin managed to hit past the $100 mark once again, only to stay in the bearish market trend that has engulfed the cryptocurrency sphere since May 2022.
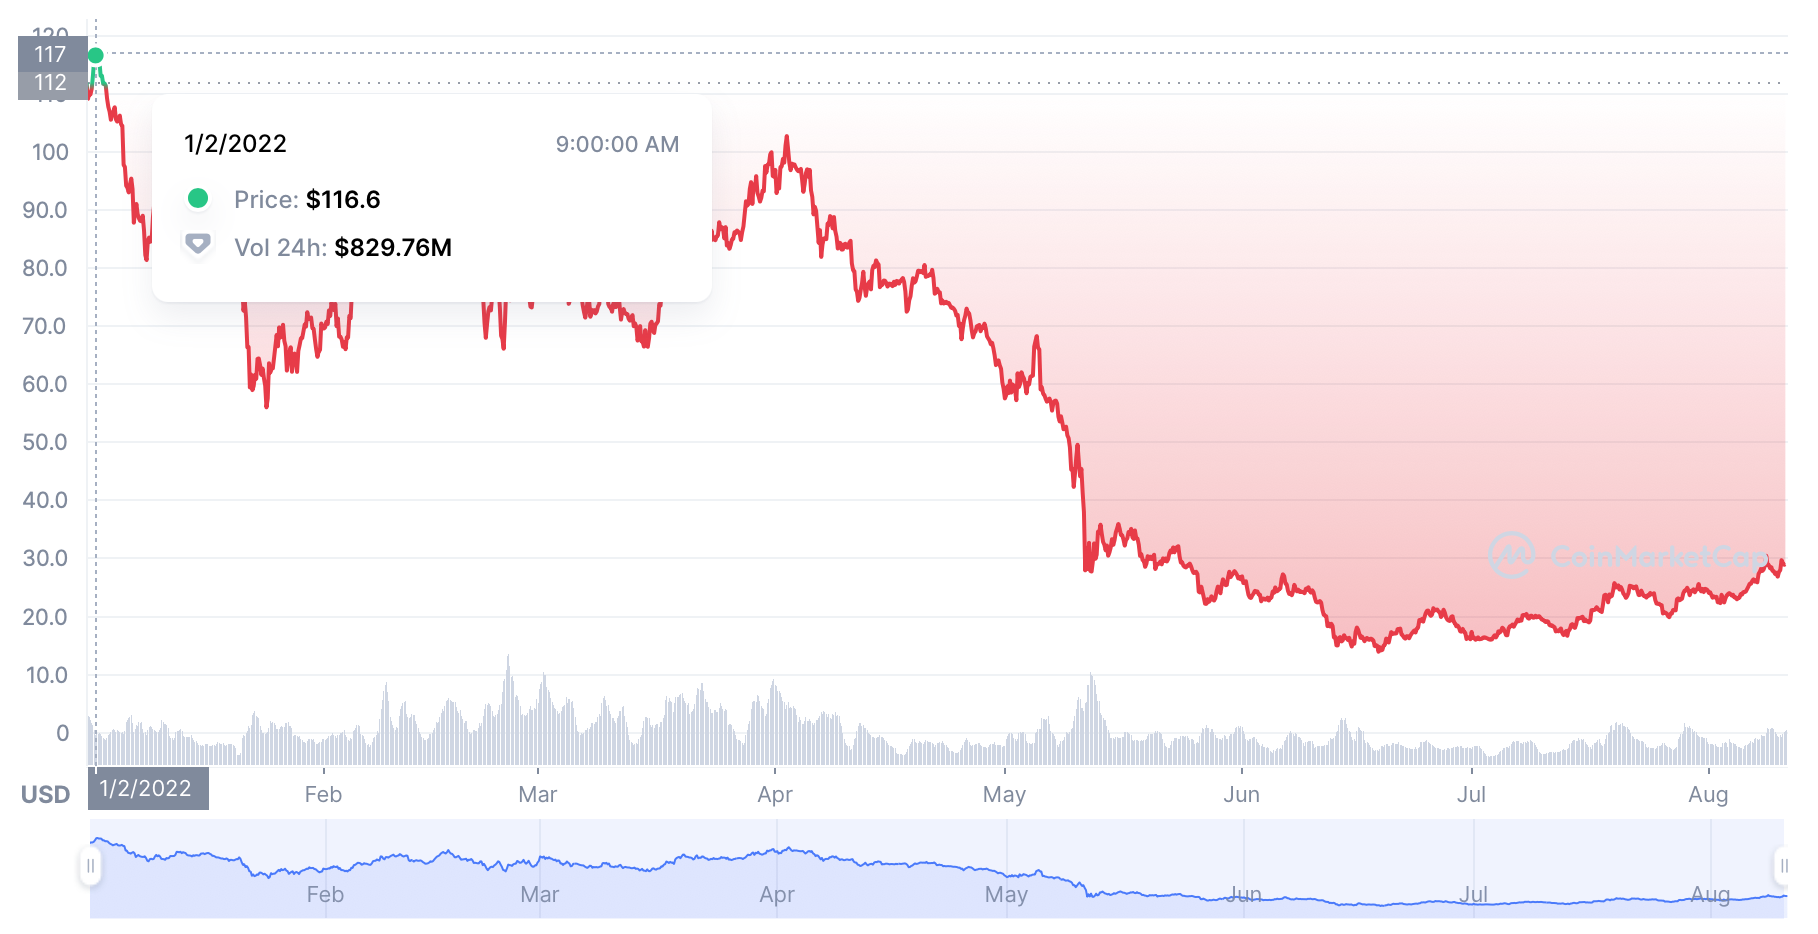
Avalanche price chart by CoinMarketCap

The YTD low was observed in June 2022 when the coin hit the $13.94 mark; however, it has mostly been hovering above the $20 mark in the past three months. At the time of writing, AVAX is trading near the $30 mark and is most likely to breach it soon.
Avalanche Price Analysis: Cup and Handle formation to push price bullish
Avalanche price has been moving quite independently of the cryptocurrencies with a higher market capitalization. This is mostly owed to the very nature of the cryptocurrency and the Avalanche ecosystem that allows new blockchain deployment and Ethereum-compatible dApps development. However, the buy/sell trend evident throughout the market is evident on the Avalanche price charts as well.
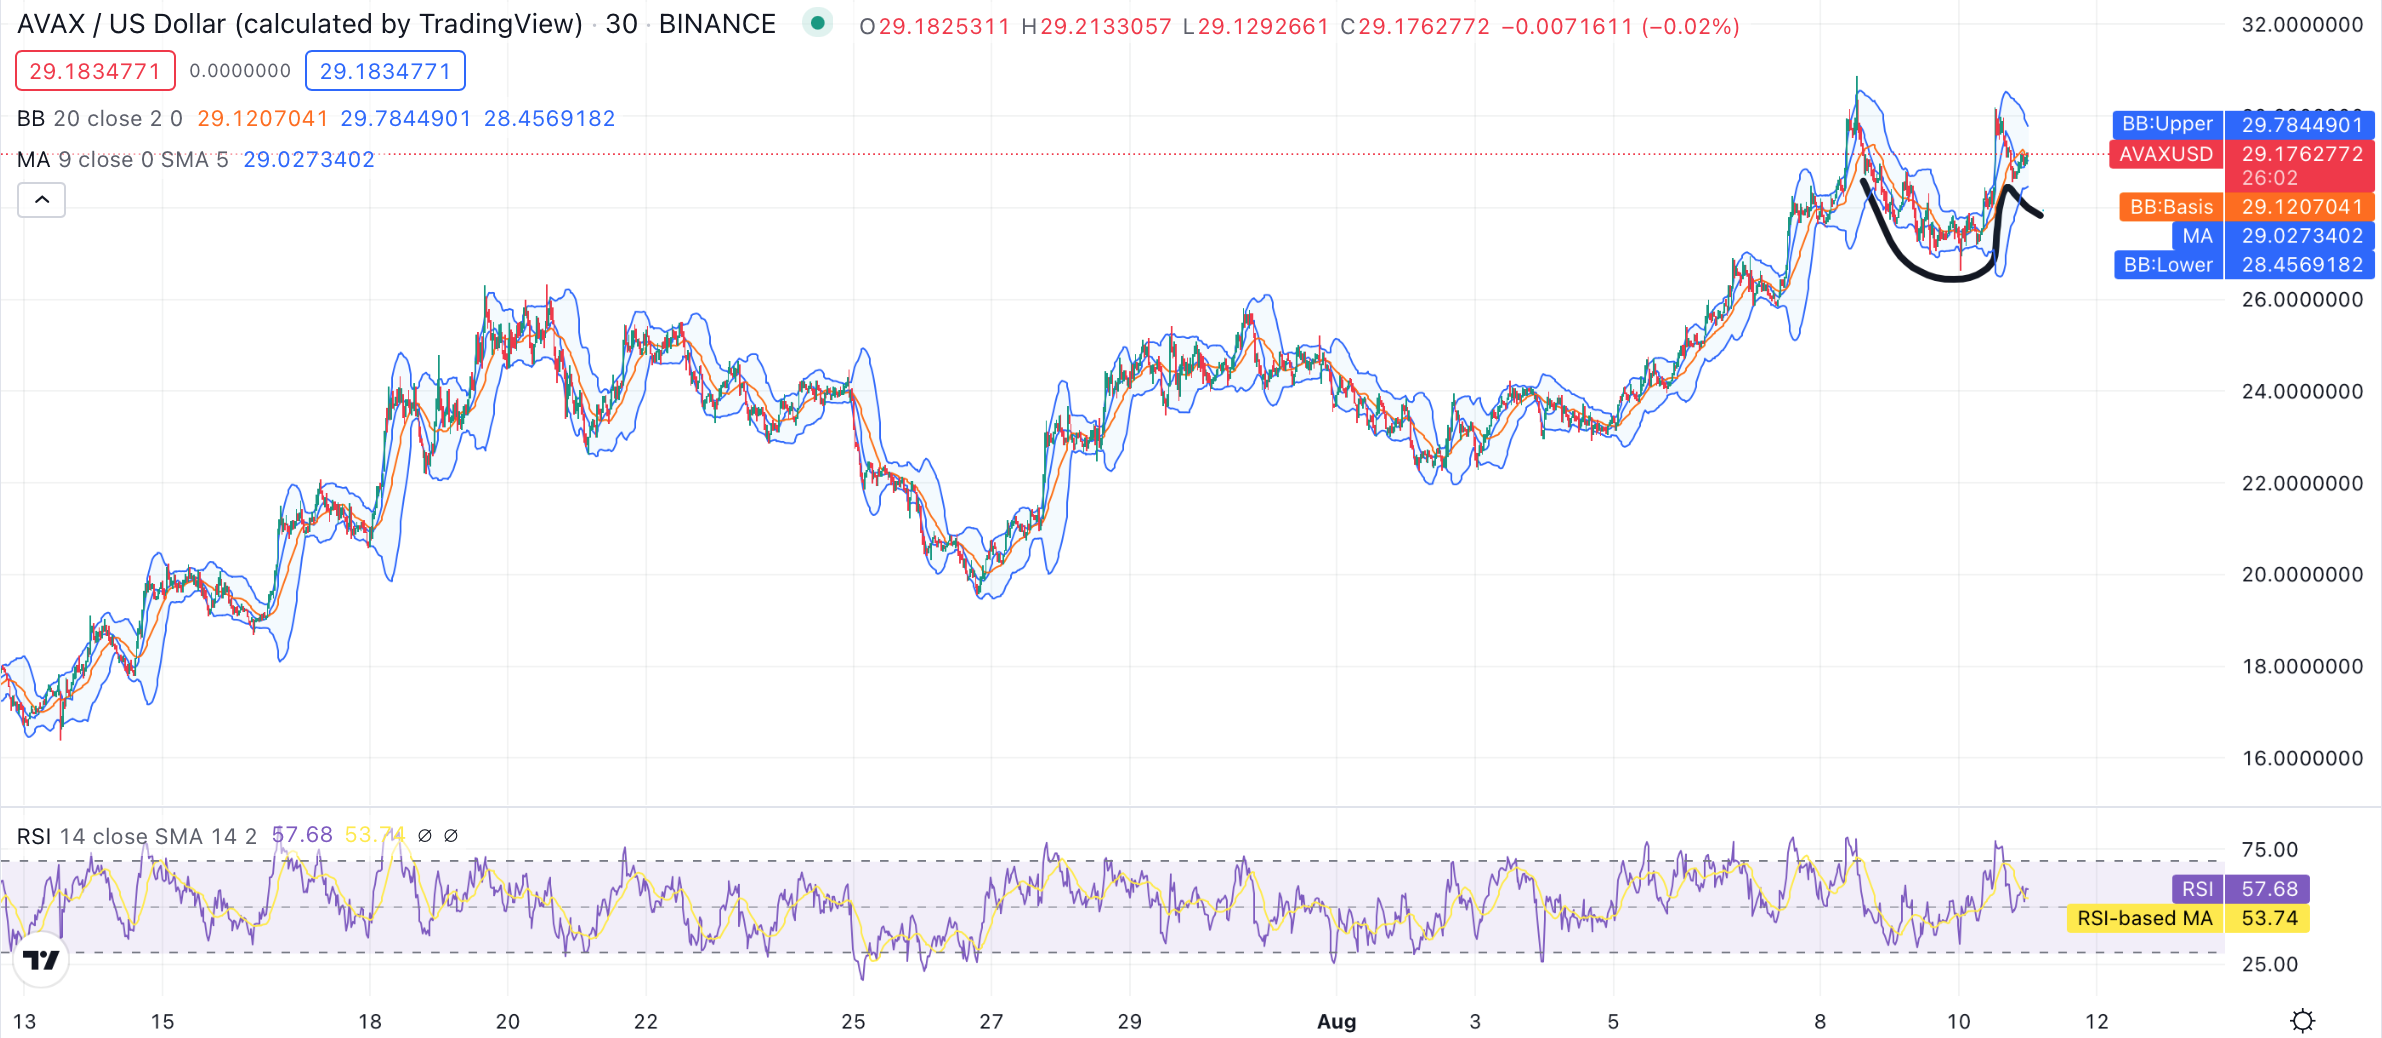
Avalanche price analysis chart made with TradingView

Avalanche price crossed the overbought threshold twice since the 7th of August; however, since the late hours of the 9th of August, the cryptocurrency has mostly been floating in the oversold zone. It was until another buying trend was observed on the relative strength index (RSI) chart. The latest buy streak pushed the cryptocurrency into a bullish momentum, starting a chart formation.
The cup and handle chart formation started brewing with the 8th of August high, which is also the 30-day high recorded at the $29.77 mark. The next time AVAX price neared the mark is, the second high of the cup recorded slightly higher at the $29.96 mark. Since then, the price has declined to the current AVAX price recorded on the chart above.
The cup and handle is a bullish indication pattern, where the decline after the cup is an indication of the brewing bullish trend. At the time of writing, the current pattern is likely to push the AVAX price above the $30 mark with a likeliness of stabilization above it.
With the AVAX price at $29.17, the current resistance is found with the Bollinger Band upper limit at the $29.78 mark. While strong supports are persistent with the Bollinger Band average (BB: basis) at $29.12, the moving average (MA) at the $29.02 mark.
While the strongest support is found with the Bollinger Band lower limit found at the $28.45 mark. While the RSI index is showing a good score; however, overbought leaning at the 57.68 mark, while the RSI moving average is found lower at the 53.74 mark.
Traders are likely to make gains as the cup and handle formation plays out until the end of the week, with no major market sways in sight.
Take Aways
- Avalanche price is moving up steadily.
- Cup and handle formation gives away a bullish indication.
- Strong supports are holding the price near $30 mark.
- Avalanche likely to break past the $30 mark and maintain it.
- No major market sways in sight for the cryptocurrency.
Disclaimer: The information provided on this page is most accurate to the best of our knowledge; however, subject to change due to various market factors. Crypto-Academy encourages our readers to learn more about market factors and risks involved before making investment decisions.