


APE Technical Analysis – March 2022
Apecoin (APE) is one of the newest cryptocurrencies in the market. Founded by YugaLabs, the founders of Bored Ape Yacht Club – one of the most successful NFT collections – Apecoin entered the top 50 market rankings within a day. While its chart suggests that the starting price of APE was around $40, the price declined after its launch. With the all-time high being at $40, APE initially retraced to around $6.15. After that, the price had another surge upward, where it found resistance at $18.
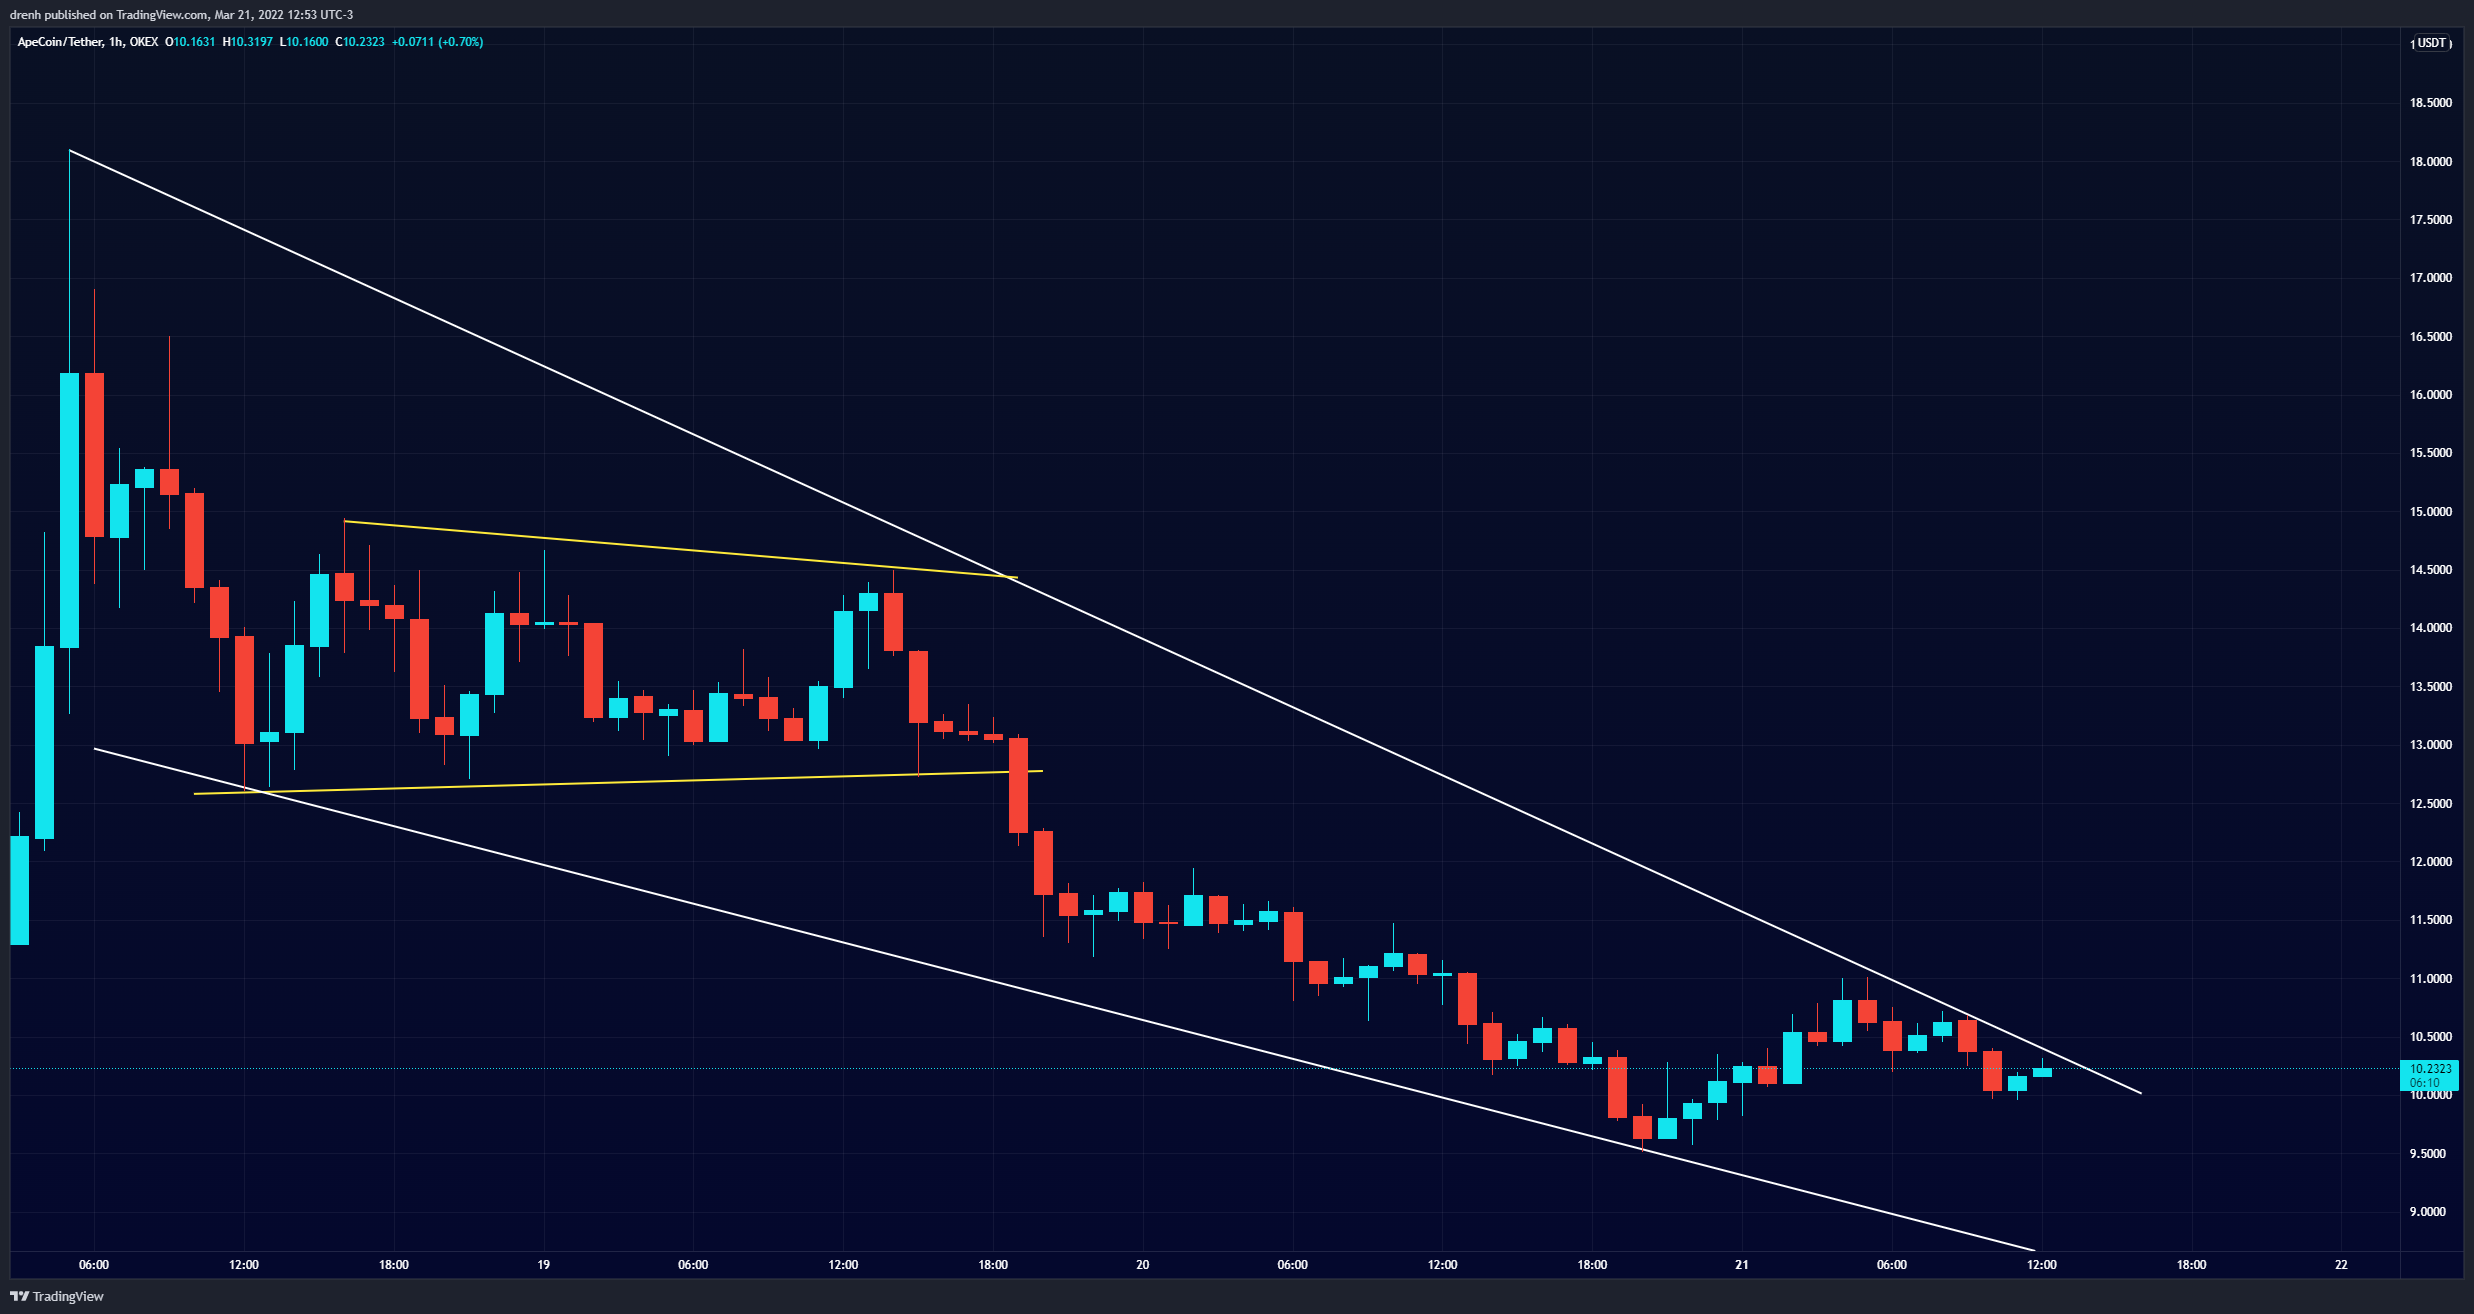
After that increase of almost 200% after the dip, APE started declining again. The price entered a phase of consolidation in the 1-hour chart, with a sideways channel over the course of two days. Nonetheless, high selling pressure saw APE break the support zone and head further down.
Recently, the price of APE found support at $9.50, after a bearish movement of 46% in just two days. This price volatility is normal as the project just launched. Hence. early investors are looking to maximize profits by constantly buying and selling at large levels. Nonetheless, in the 1-hour chart, the price has slightly recovered and is currently facing resistance at $11.
Despite the price decline, BAYC and Apecoin supporters have kept APE in the top 50 rankings based on market cap. With 28% of the total supply (1 billion APE) available, the market cap remains above $2 billion. The fully diluted market cap is around $10 billion. Hence, if APE would see a major surge in the price, it would likely happen now while the majority of tokens are not in circulation yet.
Moreover, recent price movement in the 1-hour chart shows that APE is moving in a descending wedge pattern, which could see the price have a breakout as the wedge gets narrower.

Key Structures
Support
- $9.50
Resistance
- $11
Indicators
Moving Average
Both the 50-MA and the 20-MA lines of a 1-hour chart are currently above the price of APE, meaning that the price could keep declining in the coming days or weeks. We could see that change if APE manages to break the current resistance at $11.
Similarly, the 9-EMA line of a 1-hour chart is also above the current price of APE, meaning that the trend is bearish in the shorter run for APE and that the EMA line could act as resistance to the price.
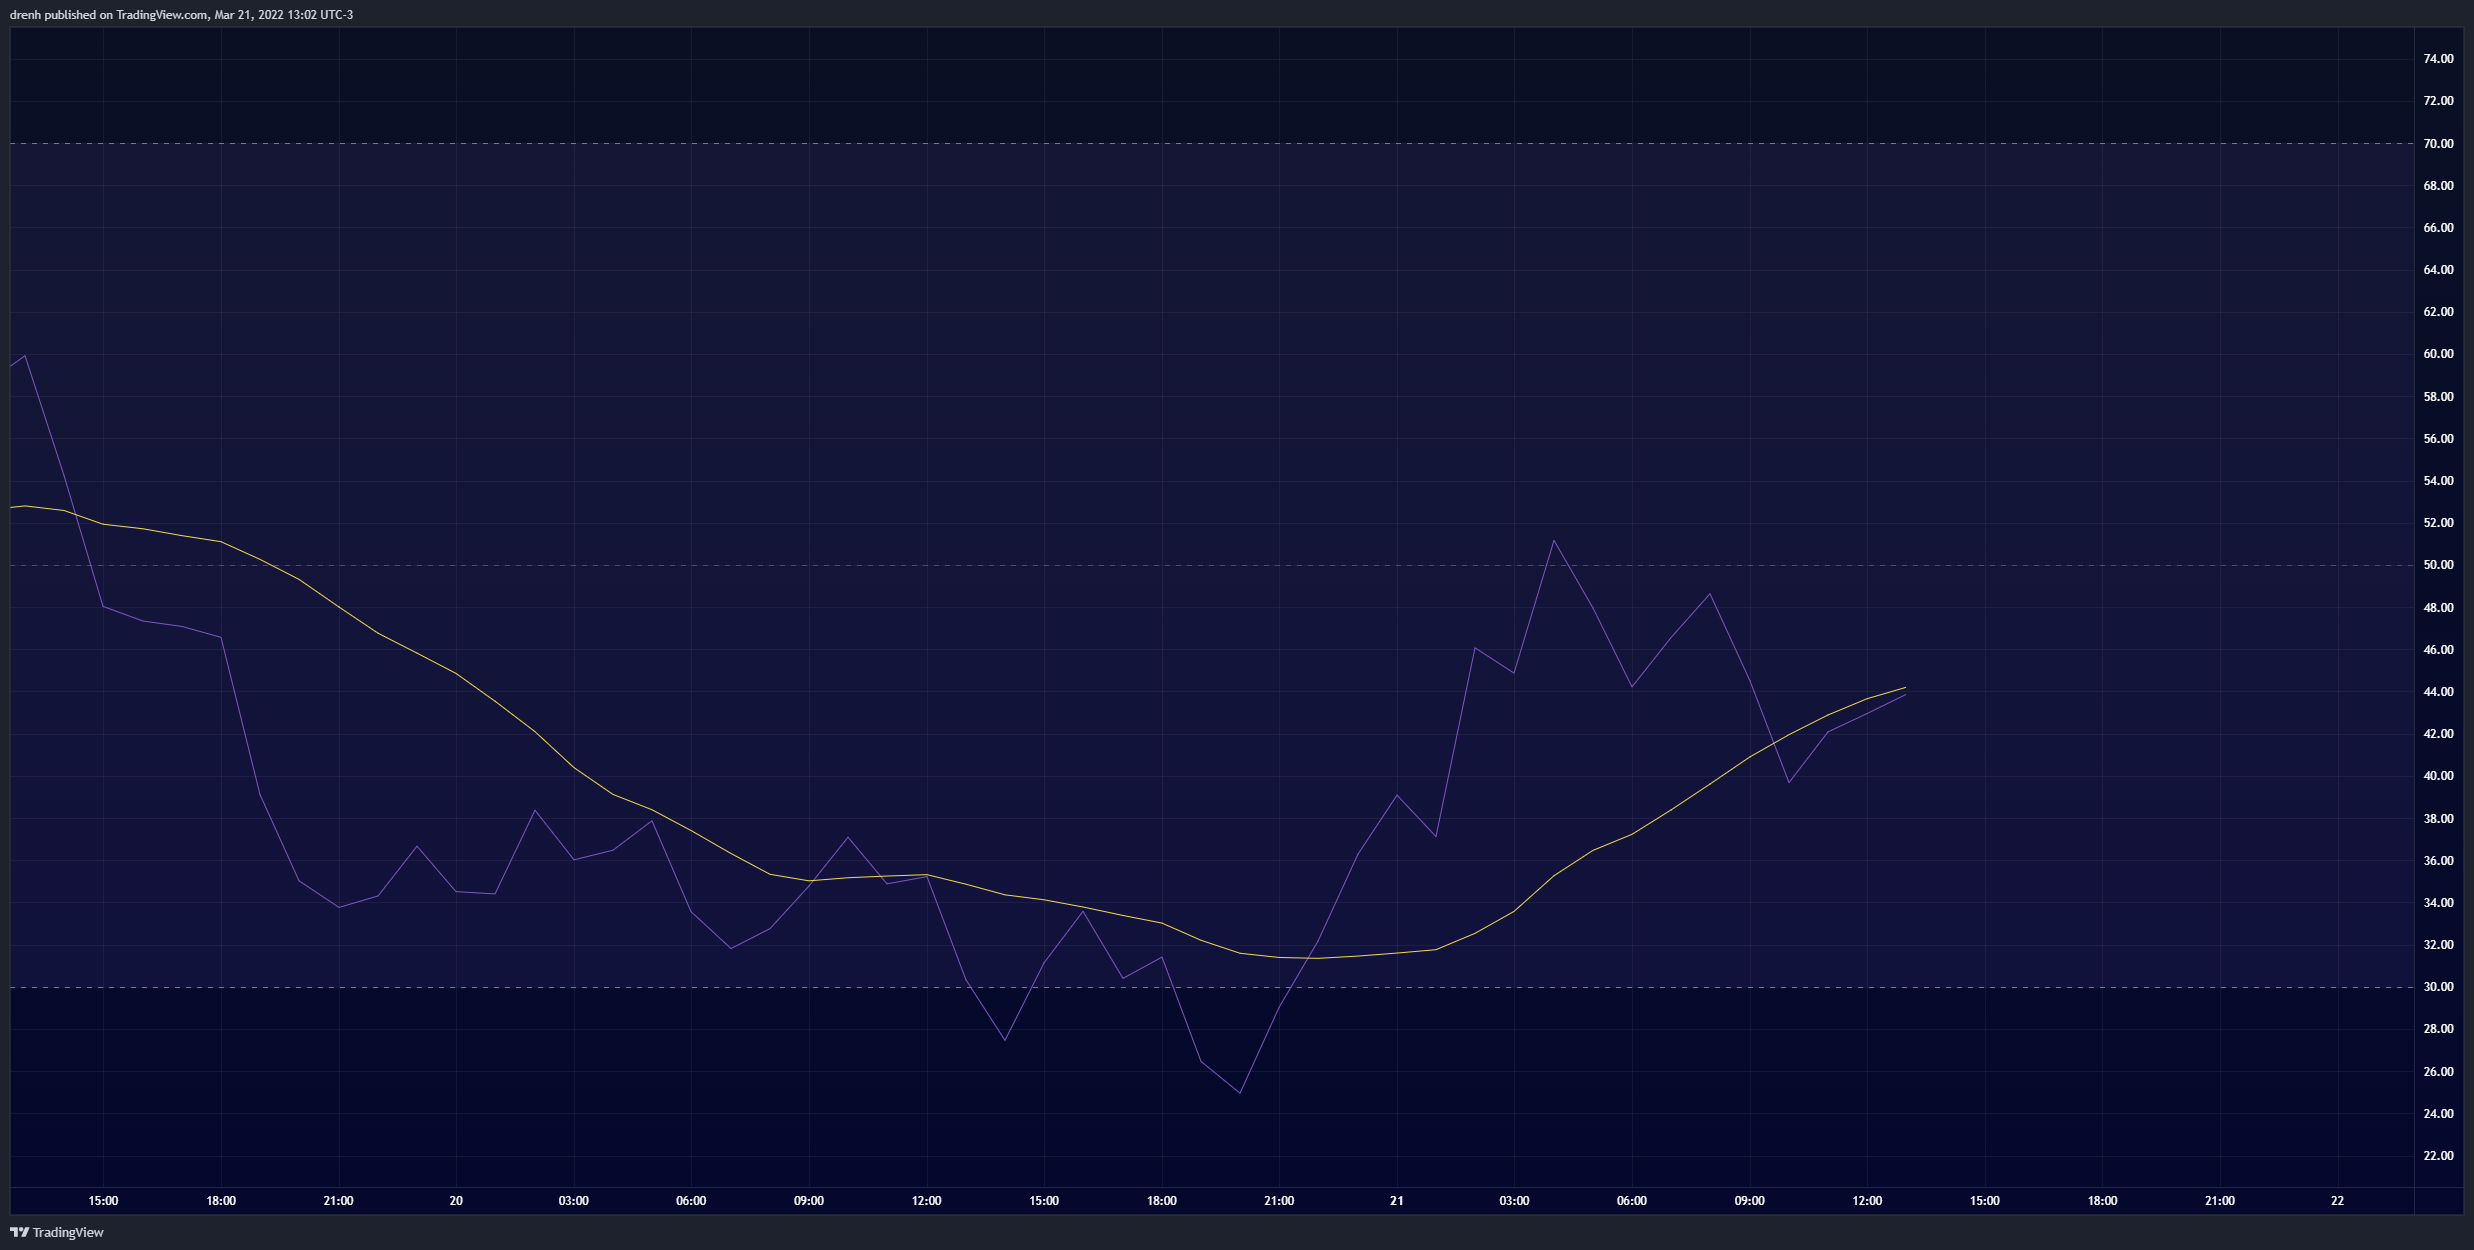
Relative Strength Index
The RSI of a 1-hour chart recently went below 30, meaning that APE became oversold. Because of that, the price then rebounded and is now slightly below 50. Nonetheless, this indicator shows that the selling pressure is high and that APE may continue to decline in the shorter run.

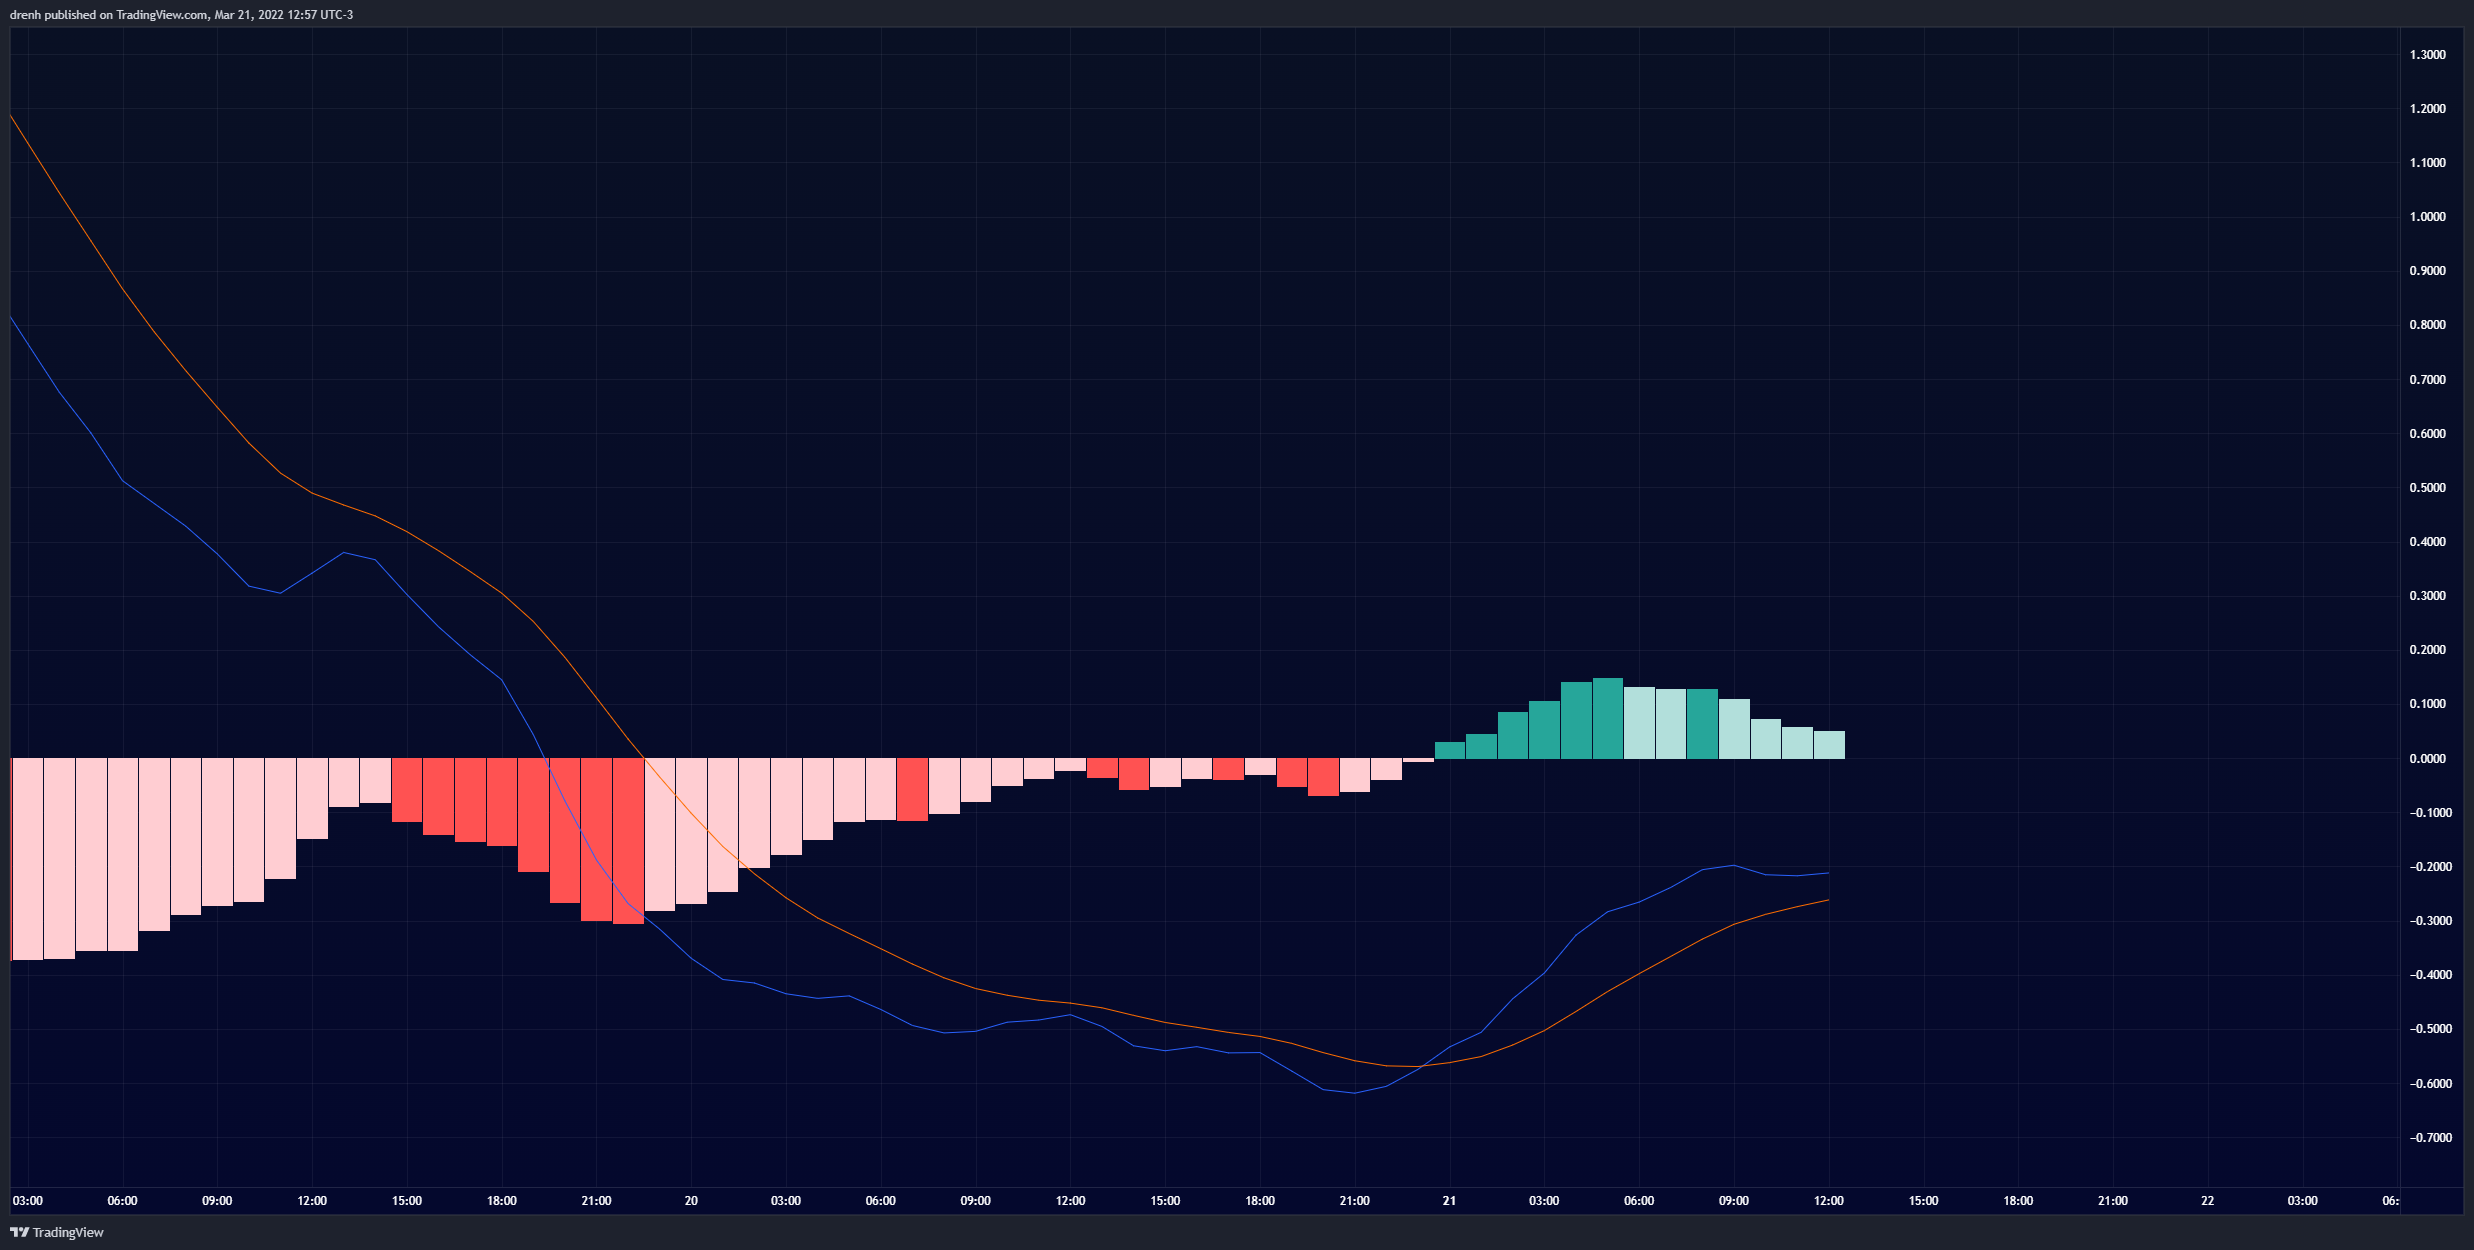
MACD
The MACD line of a 1-hour chart is currently above the signal line but below the baseline. While the momentum is bullish, the lines are currently converging, which could see APE have a shift in momentum in the short run.
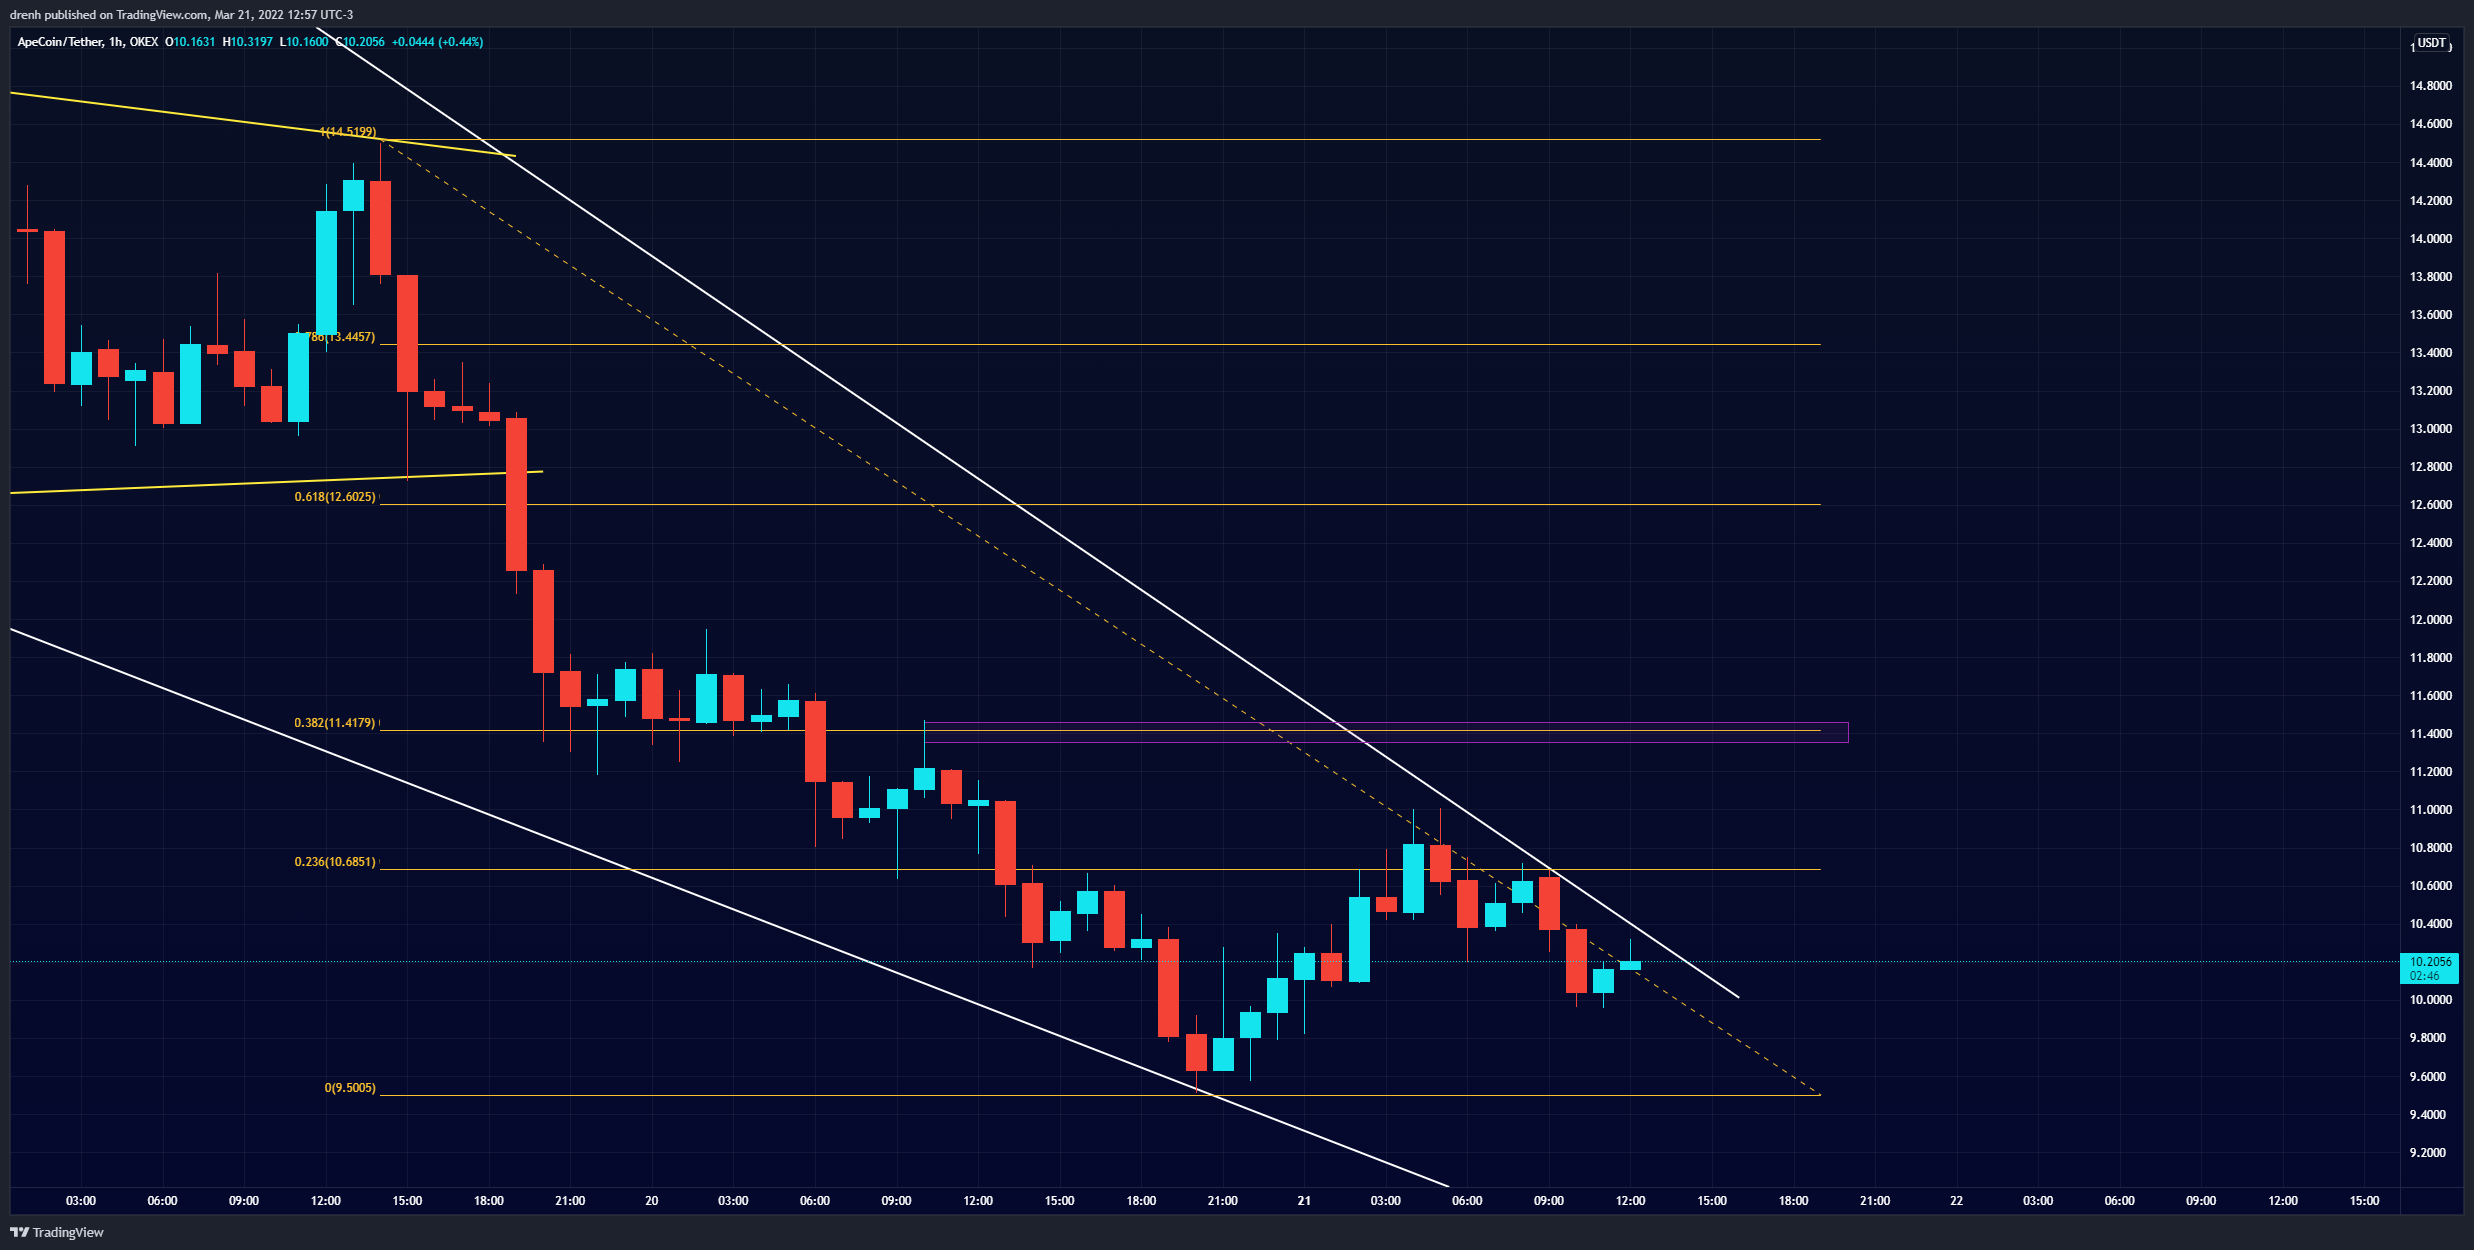
Fibonacci
The Fibonacci retracement levels of a 1-hour chart suggest that the price of APE may face resistance at the 38.2% level if it manages to break the upper trendline. Hence, even if APE manages to break above the current wedge, APE may have to face crucial resistance at $11.5, which also aligns with a previous support structure.
Price Prediction APE – March 2022
Based on this technical analysis on Apecoin (APE), the price of APE may soon manage to break the upper trendline after a slight retracement in the short run. Judging by the buying pressure on the launch day of Apecoin, there’s plenty of interest in this cryptocurrency. Since it is still the top trending coin in CoinMarketCap, and plenty of rich influencers support the BAYC project, we could see another pump in the price of APE. A price of $15 is attainable in the coming days, without taking into account the technical factors of the current price of APE.
Moreover, with only 28% of the supply in circulation, a boost in the price is much more likely now than when the locked supply is in circulation as well. Hence, APE is much more likely to reach $50 in the coming weeks. That would mean a market cap of around $14 billion, placing APE in the top 20 rankings. Despite that, we may see the price movement of BTC heavily impact the price of APE as well, considering that institutional investors are the biggest price influencers of these two cryptocurrencies.
Latest News for APE – Affecting Price
Yuga Labs has hinted that Apecoin might be the driving power of the BAYC ecosystem. With play-to-earn games up-and-coming for BAYC, where all the rich BAYC NFT owners are able to interact with one another, APE might play the biggest factor in the well-functioning of this ecosystem. To illustrate, here is how Yuga Labs teased its community about Otherside, which is powered by Apecoin.
See you on the Otherside in April. Powered by @apecoin pic.twitter.com/1cnSk1CjXS
— Yuga Labs (@yugalabs) March 19, 2022
With that said, Apecoin is already listed in major crypto exchanges, something which takes years for developers to achieve. So far, you can purchase APE in Crypto.com, Coinbase Binance, OKX, Hotcoin Global, Mandala Exchange, and many more. It’s safe to say that APE is now one of the most easy-to-access tokens in the market. Considering it launched just a few days ago, this could have a huge role in the future price of Apecoin, especially with all the updates that Yuga Labs has promised for the long run.
Last but not least, Time Magazine recently announced that it partnered with Yuga Labs, allowing users to now subscribe to the magazine using APE tokens.
Congrats to the ApeCoin DAO on the rollout of @ApeCoin & thrilled we can announce that @TIME will be accepting $APE for digital subscriptions in the coming weeks on https://t.co/tiBU5fsE5B ⏰❤️🍌🦍
— TIMEPiecesᵍᵐ ⏰ (@timepieces) March 20, 2022
All in all, things are looking good for APE, which may have achieved more in just a few days than most cryptocurrencies achieve in their lifetime. Nonetheless, its future potential is even bigger.