


ZRX Technical Analysis – October 2021
Monthly Analysis
In the last 30 days, ZRX first decreased by 27%. After that, ZRX found support at around $0.81. Then, ZRX started increasing again, and it reached as high as $1.12. Following this increase of around 40%, ZRX is now having a correction and found support at $0.94.

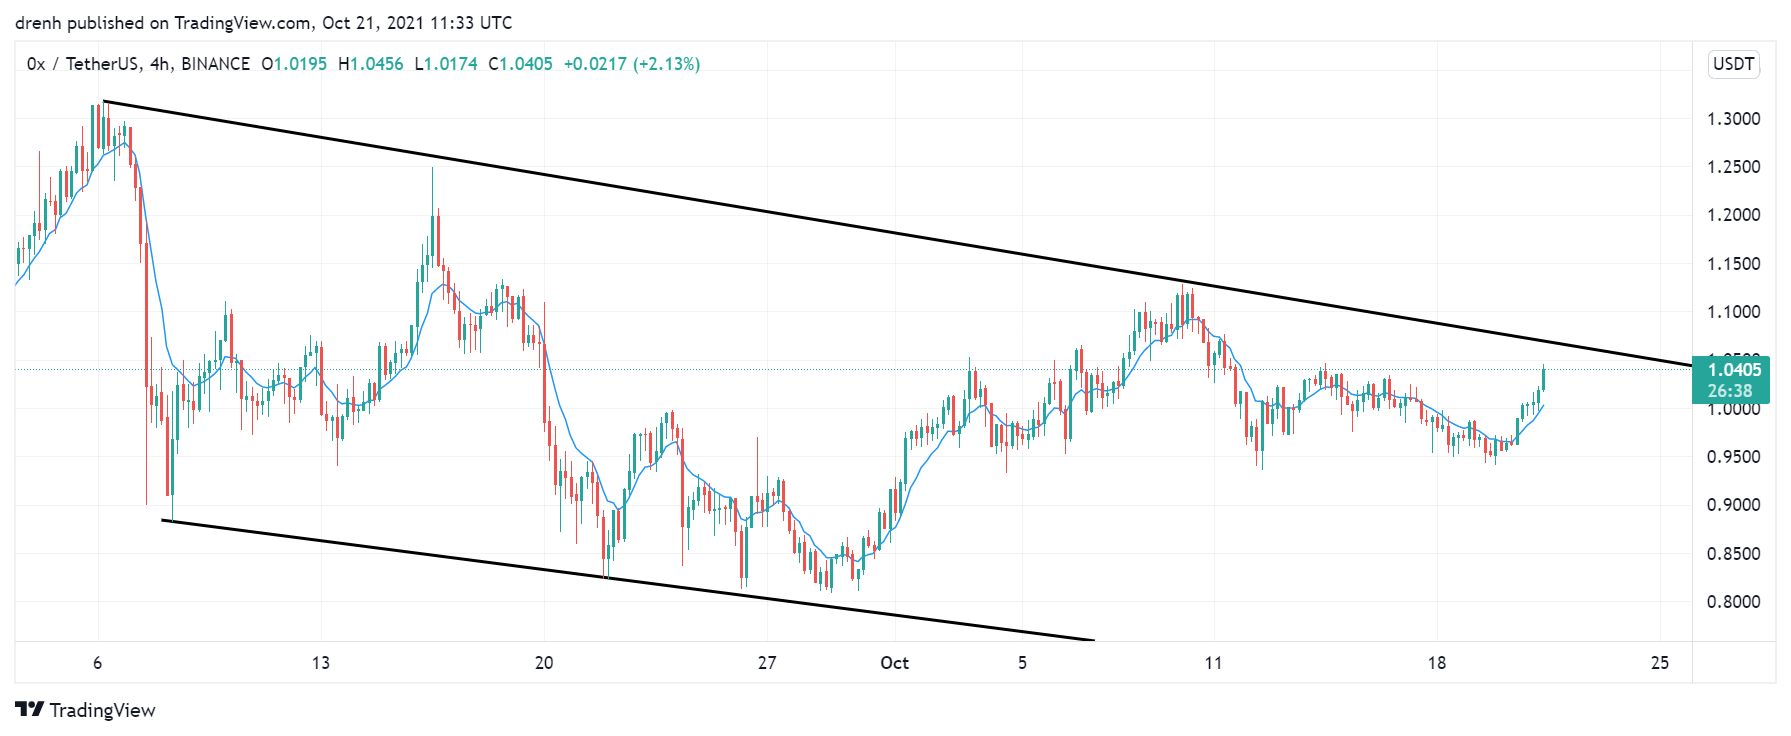
Weekly Analysis
In the last 7 days, ZRX was mainly bearish as it declined by around 0%. Nonetheless, the price recently had a bullish breakout as its price has increased by around 16%. The price has declined again after that, but it is still bullish in the short run.
Daily Analysis
In the intraday chart, ZRX has increased by more than 9%. However, the price was then followed by a decrease of 7%. If the next low is higher than the previous one, then ZRX can maintain its short-run uptrend.
Key Structures
Support
- $0.94
Resistance
- $1.12
Indicators
Moving Average
The 20-day moving average is above the price of ZRX, indicating that the trend is now downward and that the price can keep decreasing in the coming days.
The 9-day EMA is below the price and is currently acting as support for the price of ZRX. This indicates that the price of ZRX could keep increasing in the coming days if the daily candlestick closes above the EMA line.
Relative Strength Index
The RSI of a daily chart is daily average and around 50, meaning that ZRX has a lot of room for an increase in the coming days. In a 4-hour chart, the RSI is higher and slowly approaching 70, meaning that ZRX is bullish in the short term.
MACD
The MACD line is currently below the signal line, meaning that the momentum is bearish. However, the lines are converging and they may intersect soon, indicating a shift in momentum. In a 4-hour chart, the MACD line is quite above the signal line, meaning that traders are bullish and that the price could keep increasing.
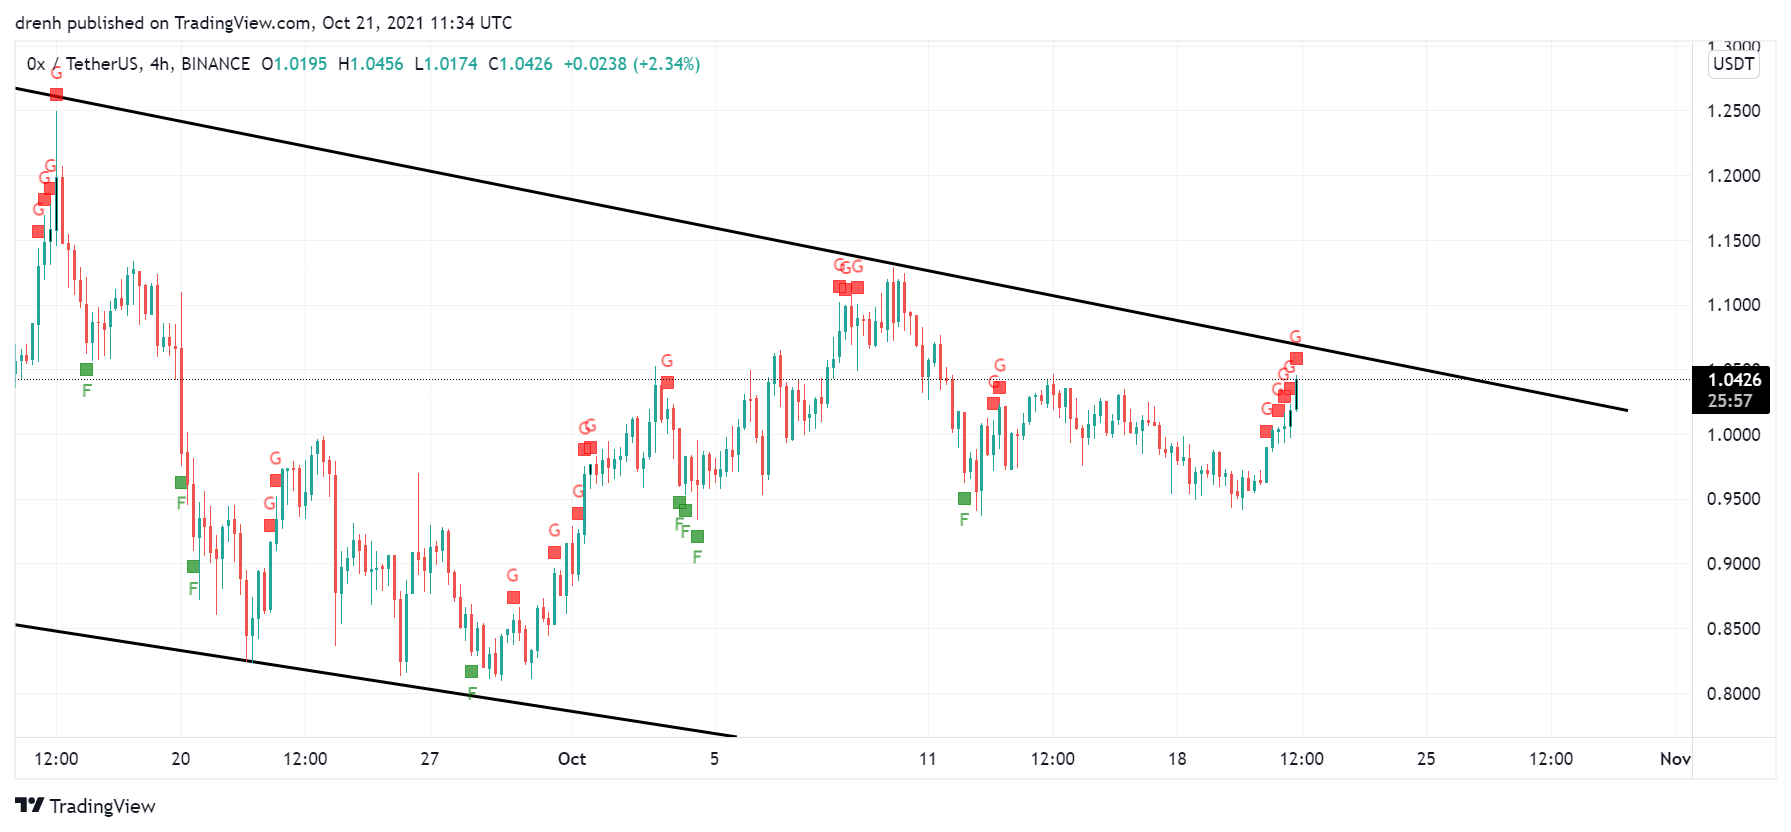
Fear & Greed
The fear and greed indicator of a 4-hour chart suggests that the current emotion of ZRX traders is greed due to the recent increase in the price.

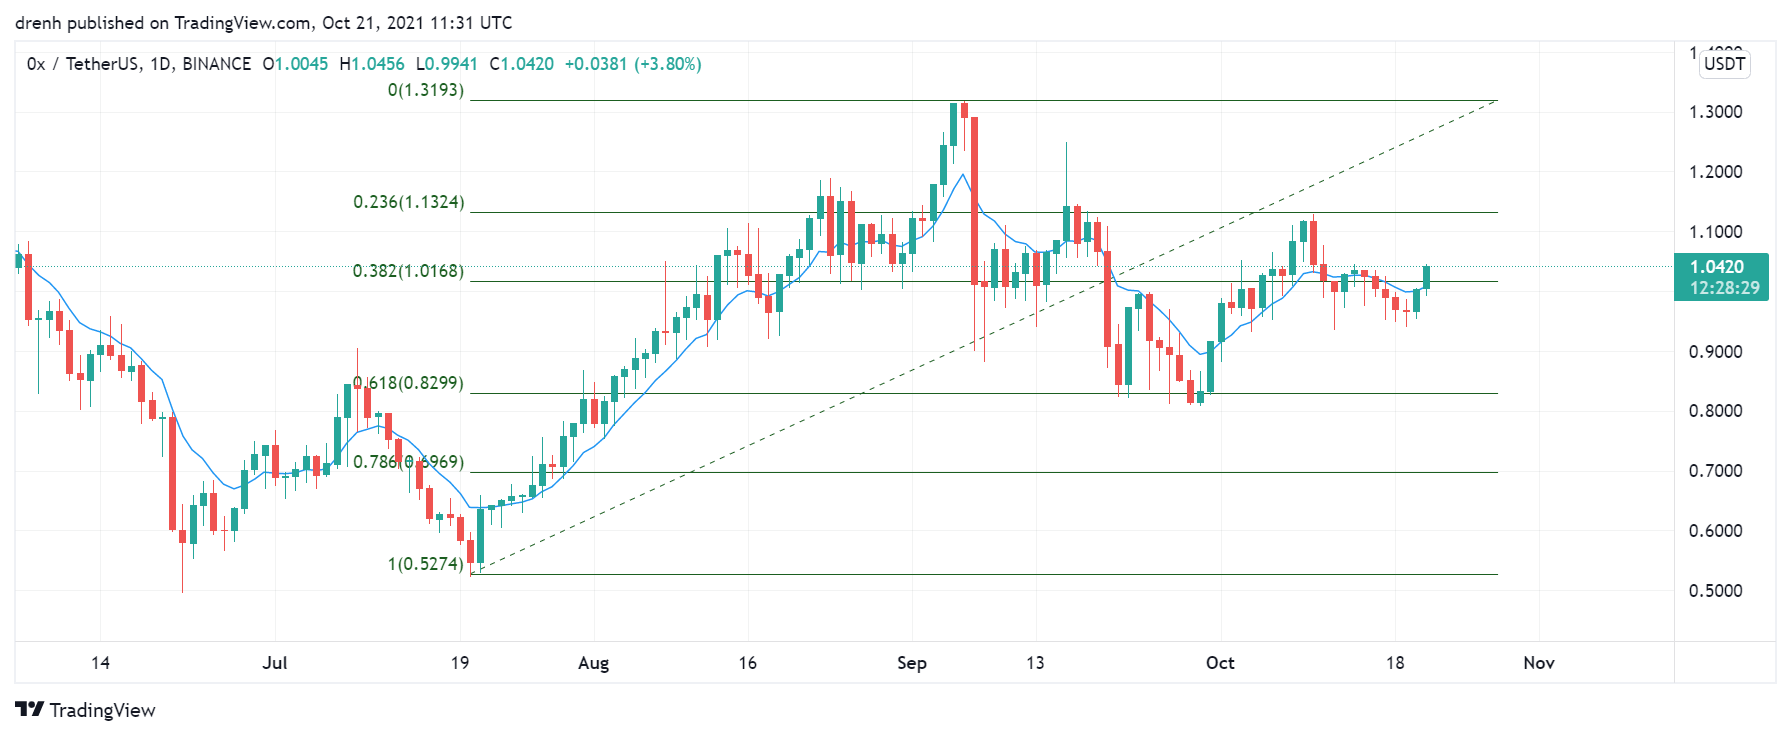
Fibonacci
The Fibonacci retracement levels in a 1-day chart suggest that the price of ZRX had found support at the 61.8% level. This indicates that the price could increase up to the 23.6% extension level in the coming weeks.
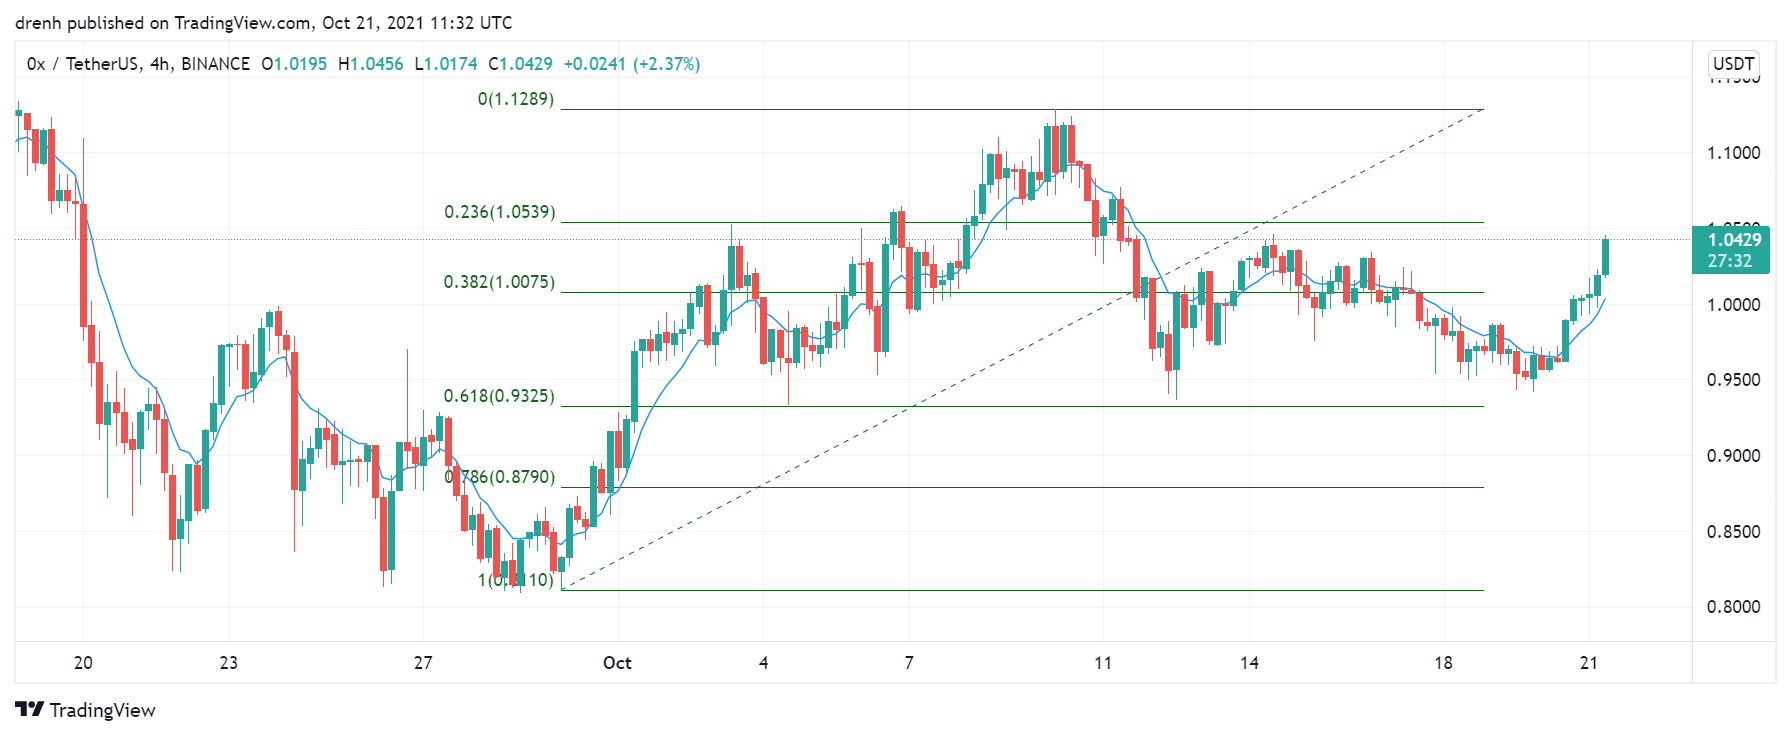
In a 4-hour chart, the price has retraced to the 61.8% level as well, meaning that the price could increase in the coming days.
Price Prediction ZRX – October 2021
Based on this technical analysis on 0x (ZRX), its price could increase in the coming days as the traders are bullish, it has respected Fibonacci levels, and BTC is increasing at larger rates. Therefore, we could see ZRX reach a new all-time high in the coming weeks, and a price of $3 is quite possible.
Latest News for ZRX – Affecting Price
Recently, Bitcoin has reached a new all-time high. It is expected that this run might continue throughout this quarter. Consequently, the market cap of cryptocurrencies is going to increase. ZRX could also increase and surge upwards.
Also read: 0x (ZRX) Price Prediction 2021 and Beyond – Is 0x a Good Investment?